Earth Sciences: 3D Geologic Modeling
Earth Volumetric Studio and EnterVol are essential tools for geologists and geophysicists.
No longer are you limited to 2D fence diagrams and crude guesses. Discover dozens of new ways to interpret your site’s boring logs as a group in 3D.
Earth Volumetric Studio has the ability to build extremely complex geologic models directly from boring logs using indicator kriging in addition to our stratigraphic modeling for sedimentary geology. Below are two examples of volcanic and karst geology that could not be modeled with stratigraphy.
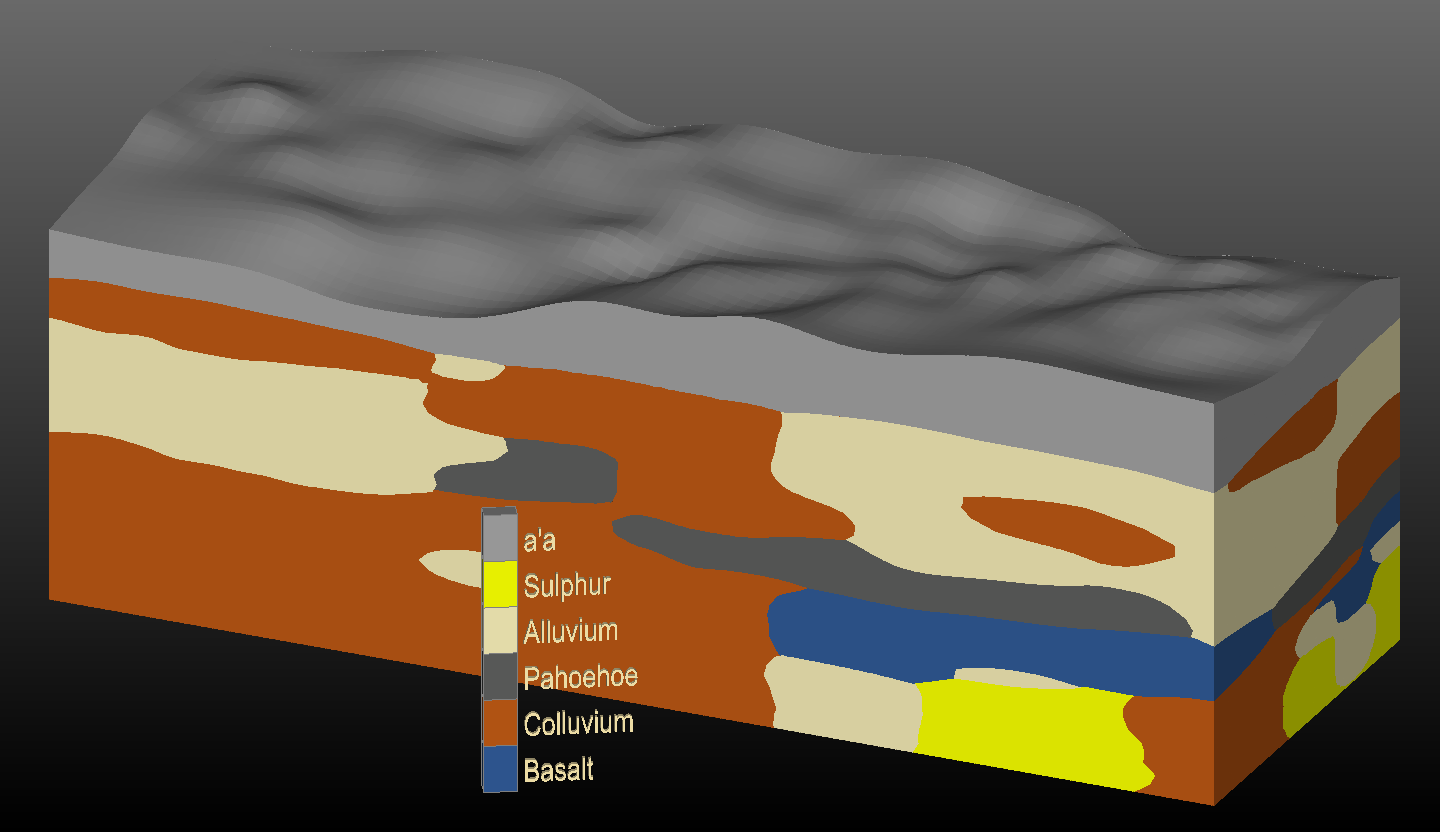
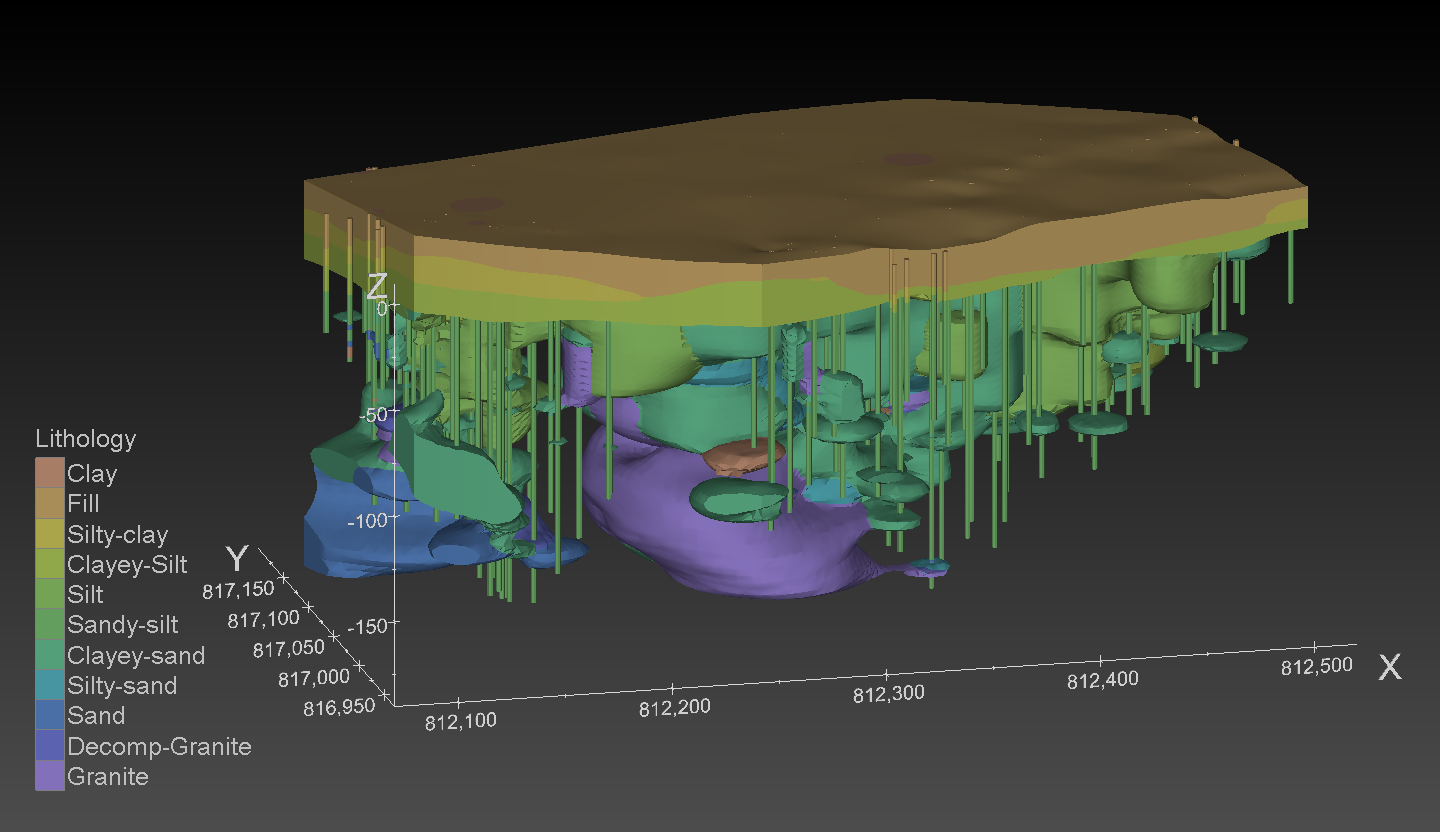
Earth Volumetric Studio can create complex models that accurately represent subsurface lithology as seen in the 3D Interactive Model below:
This model, created for the Hong Kong Geological Survey, was investigating Karst geology at the site of a multi-tower high-rise development.
Studio’s Geology modules quickly transform borehole observations into geologic structures with mass and volume calculation by geologic layer.
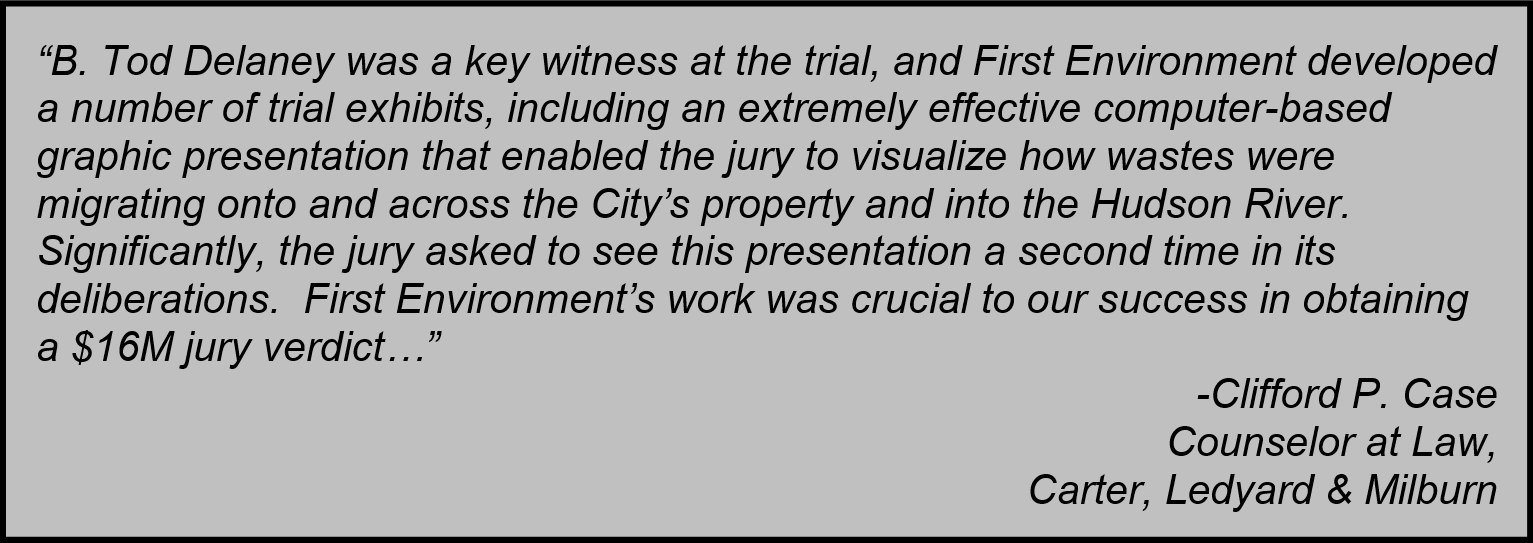
Below is a case study for an environmental litigation where the geologic modeling using C Tech’s software played a crucial role in the successful outcome and $16 million-dollar award. The modeling work was performed by First Environment, Inc..
COMPUTER ANIMATION AND MODELING AID
ENVIRONMENTAL EXPERT WITNESS TESTIMONY
Geostatistical modeling to produce 3-D graphical animations was used to support the expert testimony for the plaintiff (the City of Newburgh, New York, the client) in a case arising from manufactured gas waste contamination. The case was tried in the U.S. District Court in 1999 (City of Newburgh, New York v. Central Hudson Gas & Electric Corporation, 95 Civ. 3863). First Environment Inc. used the Mining Visualization System (MVS) geostatistical software developed by C Tech Development Corp. to visualize the site surface and subsurface conditions at a former manufactured gas plant (MGP) site in Newburgh, New York, adjacent to the Hudson River.
The intended use of MVS was to illustrate the shoreline history as well as the geology and coal tar contamination at the site. This information was used to explain the migration and accumulation of coal tar contamination related to the former MGP plant. This data was translated into three distinct models that included the historic shoreline and subsurface conditions. Once each model was created, it was used to produce a dynamic computer-driven animation that told a story that could be easily understood by laymen, and which would provide a clear and accurate basis for the expert’s testimony before a jury that ultimately helped the plaintiff’s attorneys assemble a winning case.
Site Description
The site is approximately 12 acres and is comprised of city property (streets, a wastewater treatment plant and underwater lands in the Hudson River), and a railroad right-of-way currently owned by CSX and the former MGP. The MGP and the CSX property occupy approximately 4 acres. The city property, located downgradient from the MGP, occupies the remaining 8 acres.
Shoreline Animation
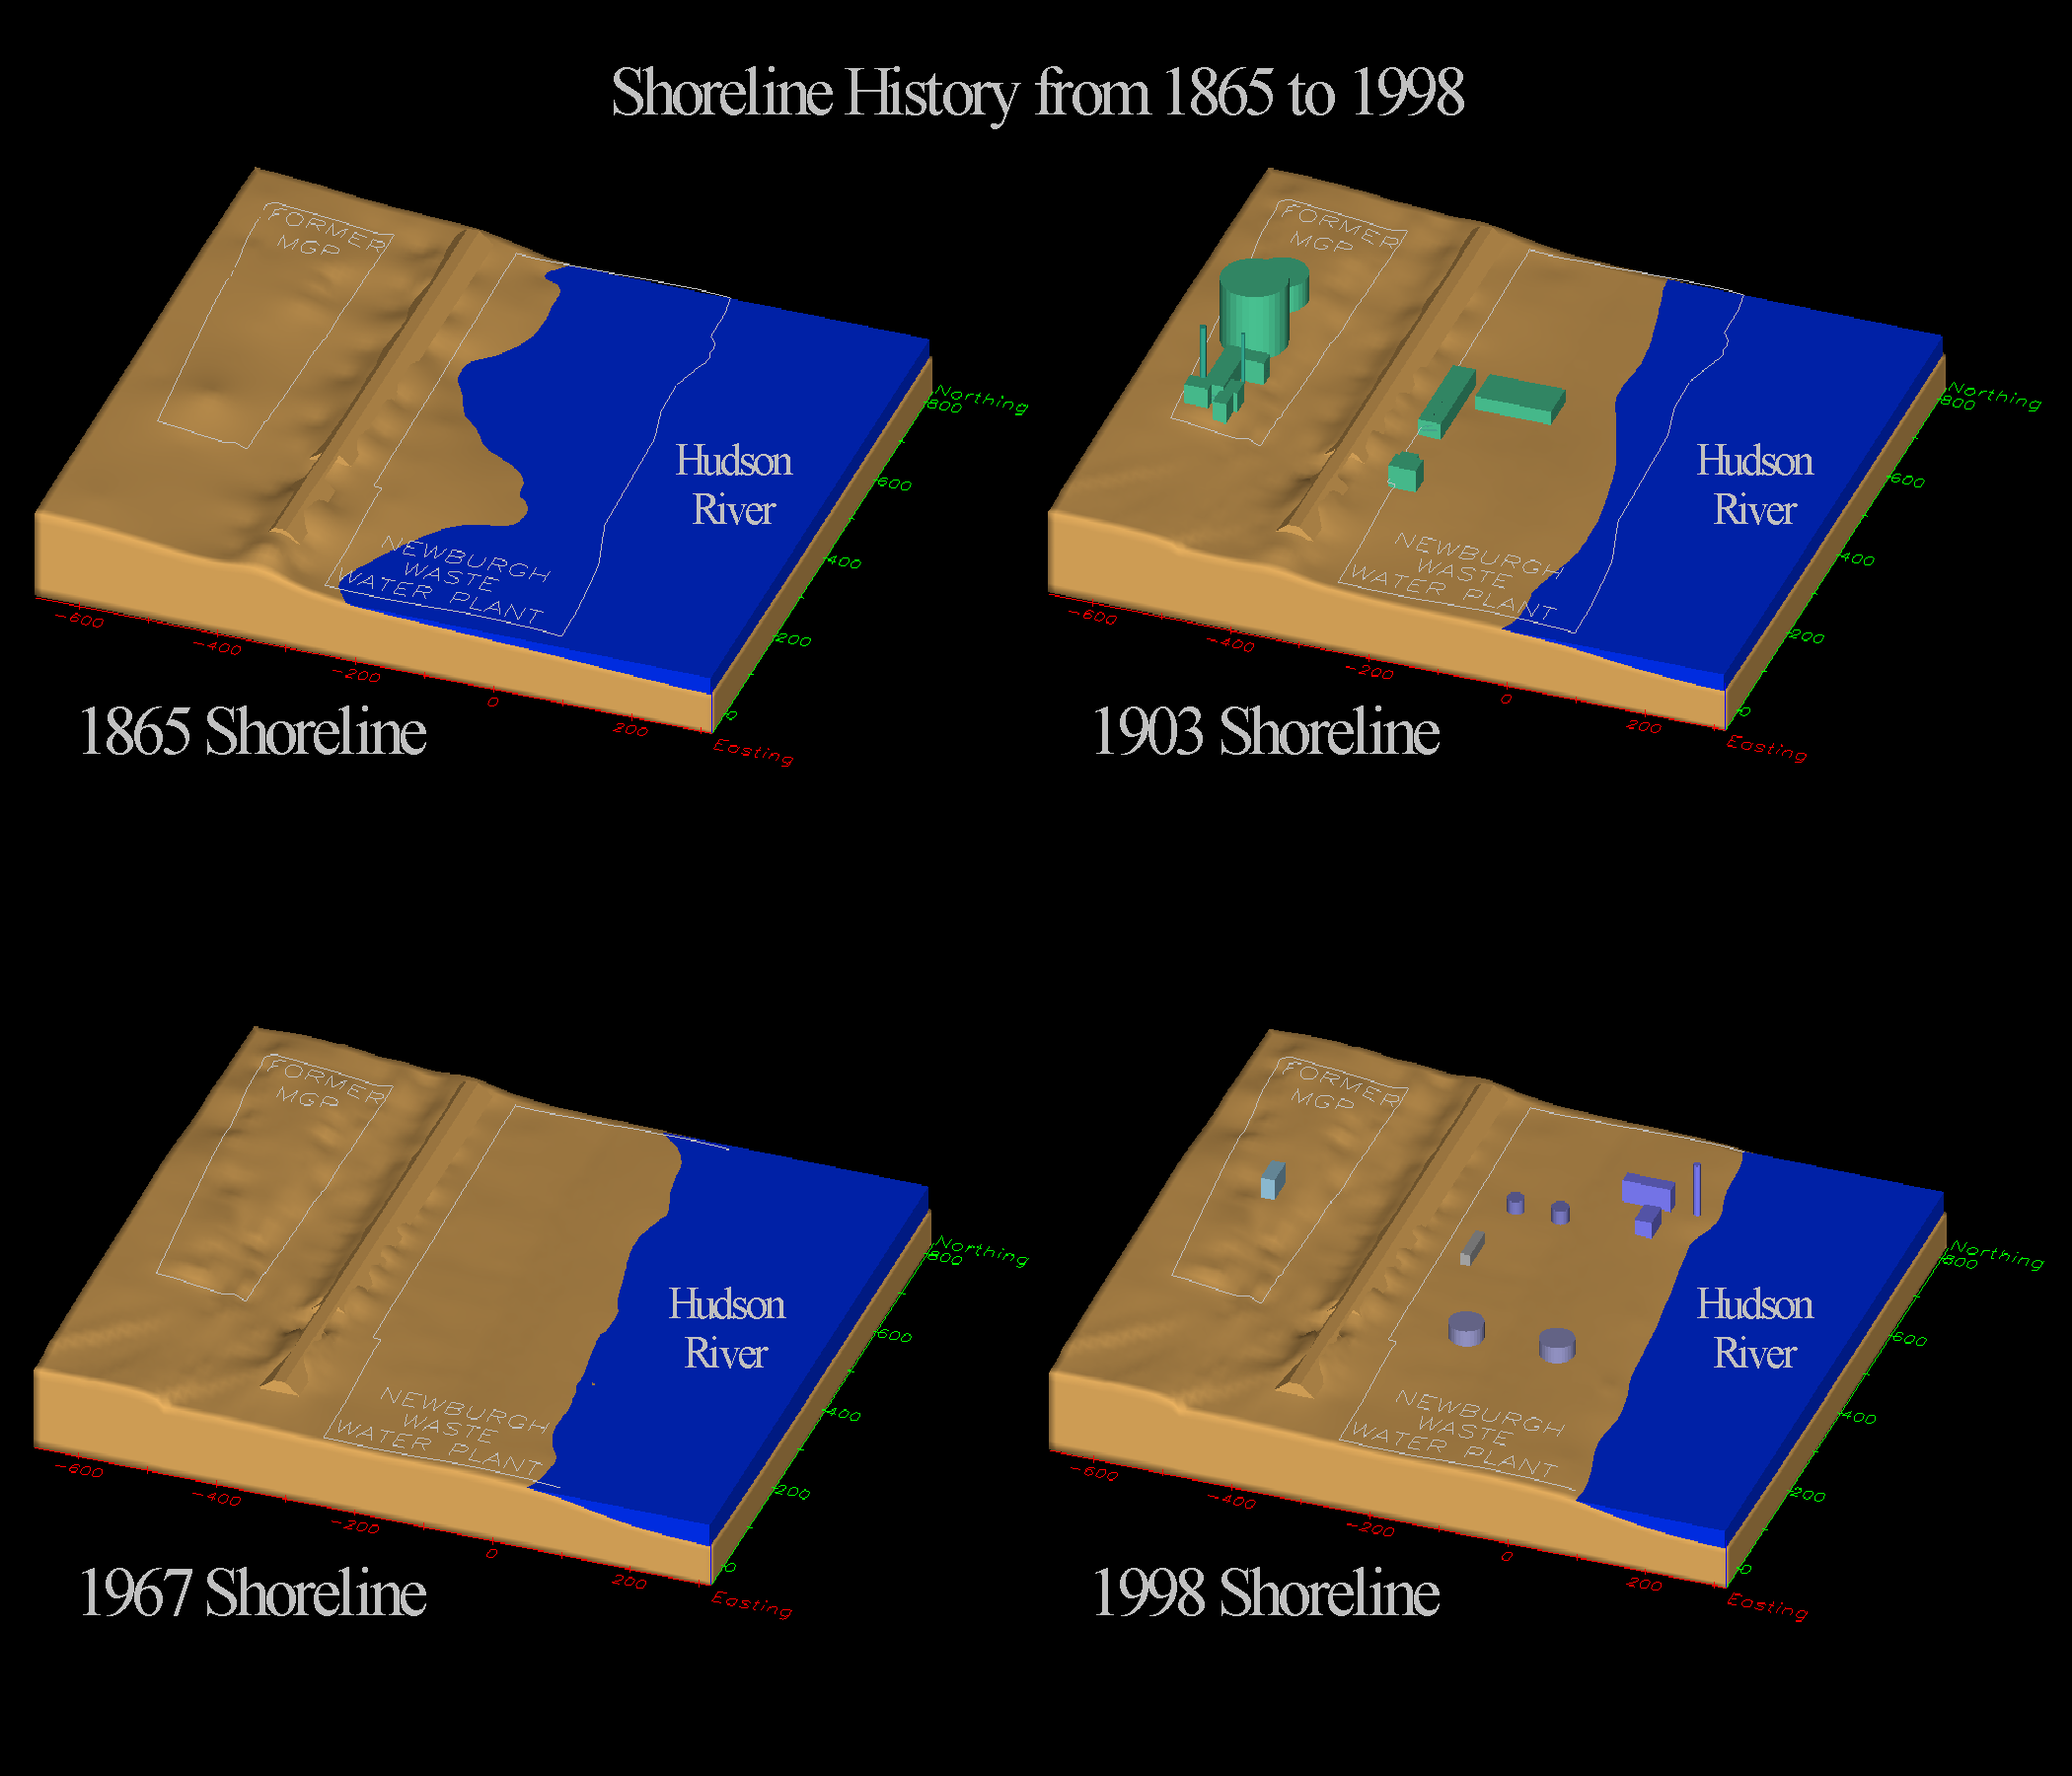
The shoreline model was created to illustrate the historic filling of land downgradient of the former MGP. The model was created from existing boring data and historic aerial photographs, as well as information from the National Oceanic Atmospheric Administration (NOAA), the United States Geological Service (USGS), and Sanborn and City of Newburgh engineering maps.
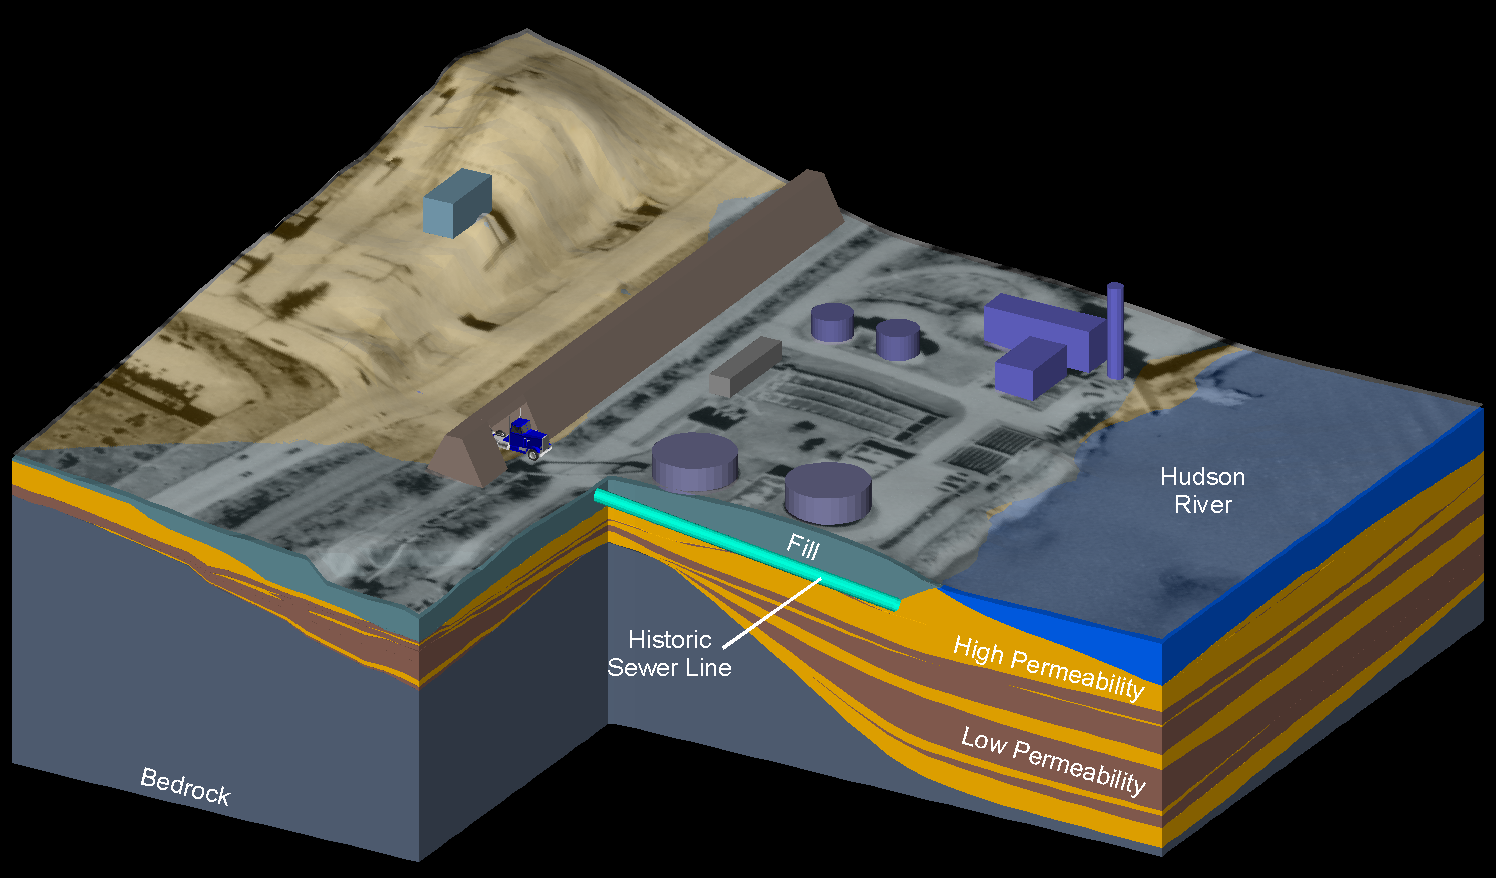
The shoreline model and animation were designed to illustrate to the court and jury how the depth, extent and configuration of fill changed during the evolution of the shoreline from 1865 to 1998. An example of one frame of the animation is shown in Figure 1.
Subsurface Animation
The three-dimensional subsurface models were designed to illustrate to the court and jury the complexity of the geologic layering, the location of former sewers, the distribution of coal tar in permeable soil layers, and the interconnection of those layers between the former MGP property and the city property.
Conclusions
The computer model and its animations were used successfully to illustrate and explain the migration and accumulation of coal tar contamination, related to the former MGP, in three separate plumes.
Once each model was created, it was used to produce a dynamic computer-driven animation that told a story that was easily understood. The animations provided a clear and accurate basis for the expert’s testimony to the jury that ultimately helped the city’s attorneys assemble a winning case. As a result, the jury found the utility responsible for $16 million in cleanup costs. Remediation alternatives for the clean up of the coal tar contamination at the project area are currently being studied under a New York State Department of Conservation consent order.