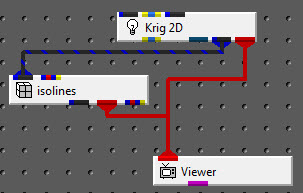
We get quite a few questions about isolines, usually about how to adjust properties. In this post I want to cover some important features in isolines as well as how to get the most out of this important module.
The isolines module in EVS-PRO and MVS is very sophisticated and has some features we haven’t seen in any other product. A series of contours are generated for you between your data min and max. For linear data (not log processed) that is normally “n” (# of Isolines) equally spaced contours between two bounds. You can also override the bounds so that they are a subset of your actual min/max.
Please note, it is not always possible to have a contour AT your data min or max. Creating contours requires that you have some data both above and below the desired contour level. One way to understand this is that your max value may occur at only a single point (node) in your grid. A countour around (or at) it would have no area.
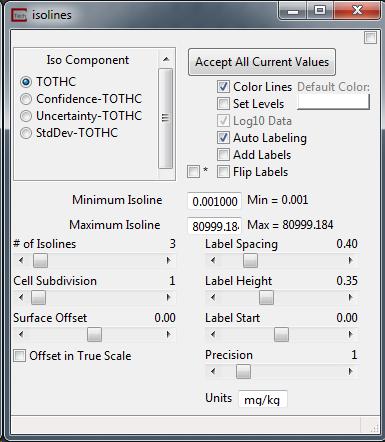
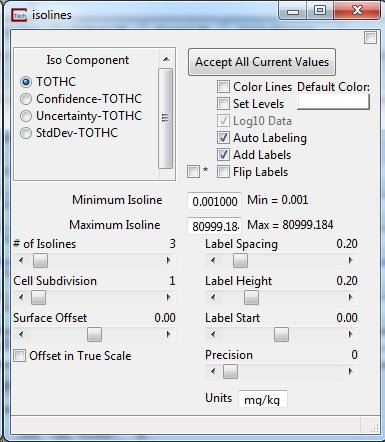
If your data is log processed isolines does a more intelligent job of positioning the contours. The “# of Isolines” slider (defaults to 3) sets the number of contours per DECADE. That means that for the example below with a min of 0.001 (log = -3) and max of 80999.184 (log = 4.908), there will be nearly 8 decades of range to this data. In other words, the data spans nearly 8 orders of magnitude (Max/Min ~ 100 million). This means there will be roughly 24 contours, though that number can vary a bit depending on your min and max. This is because the contours will be spaced roughly equally in log space and will always include even decades (e.g. 0.01, 100, 10000).
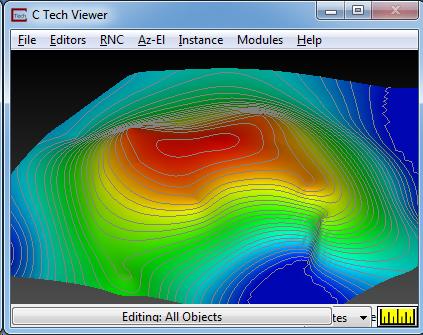
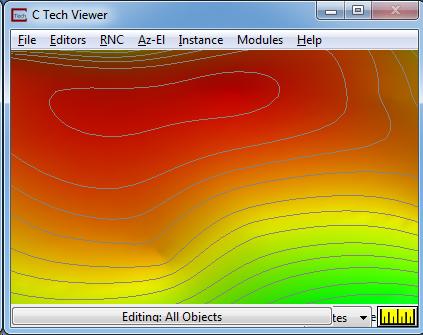
The settings above with this application will give us the following isoline contours.
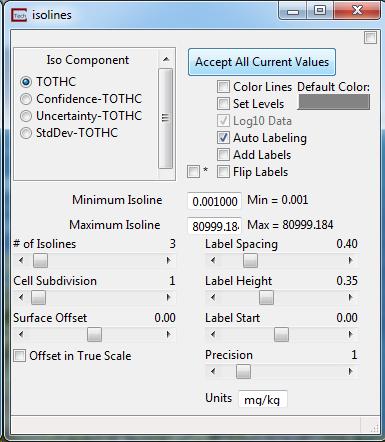
So now let’s use some of the more advanced features of isolines. Sometimes our isolines will stand out better on our surfaces if they are not colored.
We’ve turned off the “Color Lines” toggle and set the Default Color to be a medium gray.
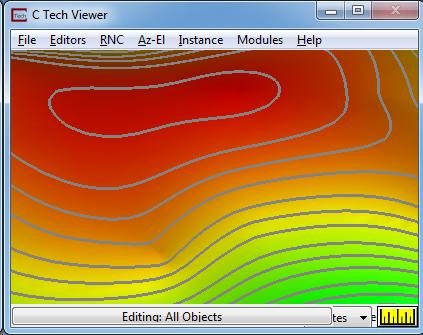
One confusing/troubling issue with isolines is that they are drawn as LINES. Unlike a triangle which has area and gets bigger as you zoom in, lines are drawn in pixels. A one pixel wide line will APPEAR wide when your viewer is small (as the pictures above), but as you zoom in the width of those lines will not change. This makes the lines seem thinner when the image resolution is high. Below is the same settings zoomed in.
In this situation there are two ways to make the lines wider. The quickest is to edit the properties of the isolines. You normally do that by first selecting the isolines “object” in the Viewer and then go to Editors…Object…Advanced_Settings.
If isolines are your only line object, OR if you want all line objects in the Viewer to be wider, you can actually skip the step of selecting the object. If you do, you’ll be changing the properties of all line objects.
I wouldn’t be thorough if I didn’t mention the other way to make “wide” lines. The tubes module can be connected to the blue-black output of isolines and will turn your lines into tubes. Tubes are drawn with triangles and have real dimensions. You can make them any size and when you zoom on them they get bigger. The downside is that they are more complicated and take memory and graphics resources. They also are 3D and extend from your surface…..sometimes a good look….sometimes not.
With the settings above, the lines are now 3 pixels wide. They will now look much wider.
Before we finish here, let’s put labels on our lines. That is where our isolines stand out among all competitors.
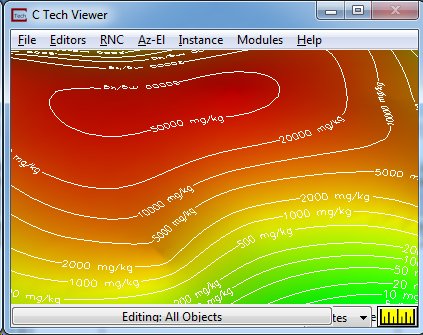
The labels we create are drawn as 3D lines that hug the terrain of the surface on which the isolines are generated. The text follows the line contours and is fully adjustable in height and spacing and can include the units. From our last view, we’ll go back to 1 pixel line width, change the color to be white (to stand out more) and turn on the labels.
Notice above that there are two “Flip Labels” toggles. Since surfaces can be viewed from either side and sometimes you may be zoomed in on a view that has the labels upside down or even mirror imaged, these toggles give you the ability to fix your view. Usually (as below) this is not necessary.
There are other isoline options which we won’t cover here, but are discussed in the help. I hope you find this Tip useful.
Reed

