Life Sciences: Ocean and Lake Sciences
Oceanic and lake sciences challenge the abilities of traditional software tools. Virtually everything of interest lies beneath the surface. This is a 3D world with complex issues that affect the life in these water bodies and all life on Earth. Earth Volumetric Studio’s modular toolkits provide the technology to address a myriad of surface and subsurface issues.
The US National Oceanic and Atmospheric Administration’s Pacific Marine Environmental Laboratory and Russia conducted oceanographic research in the Chukchi Sea in September and October 1990 to collect the data represented in these visualizations that were created with Studio. Waters from the Bering Sea feed the Chukchi Sea through the Bering Strait before entering the Arctic Ocean. The Chukchi serves as a rich feeding ground for Bowhead whales and other marine mammals, and serves as a transition area for pelagic seabird species.
CTD casts to measure Conductivity, Temperature and Depth were used to determine temperature and salinity distributions in the various water masses. This data is used to determine ocean properties that may explain fish and mammal behavior. For example, a strong cold pool or high area of salinity may aggregate prey (invertebrates and planktonic fish), thus providing fertile feeding areas for marine mammals.
Fisheries ecologists and wildlife biologists attempting to understand the relationship between marine mammal foraging, prey densities and physical environments may overlay foraging data from satellite or radio-tracked animals with oceanographic data to understand these interrelationships during one season or over several years of data.
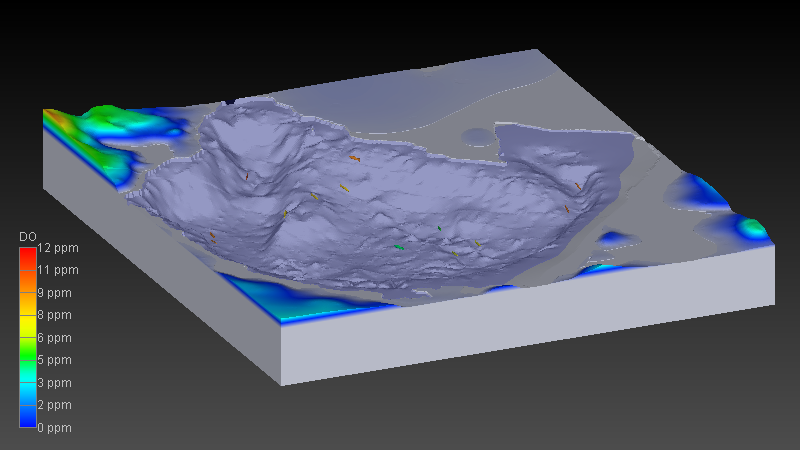
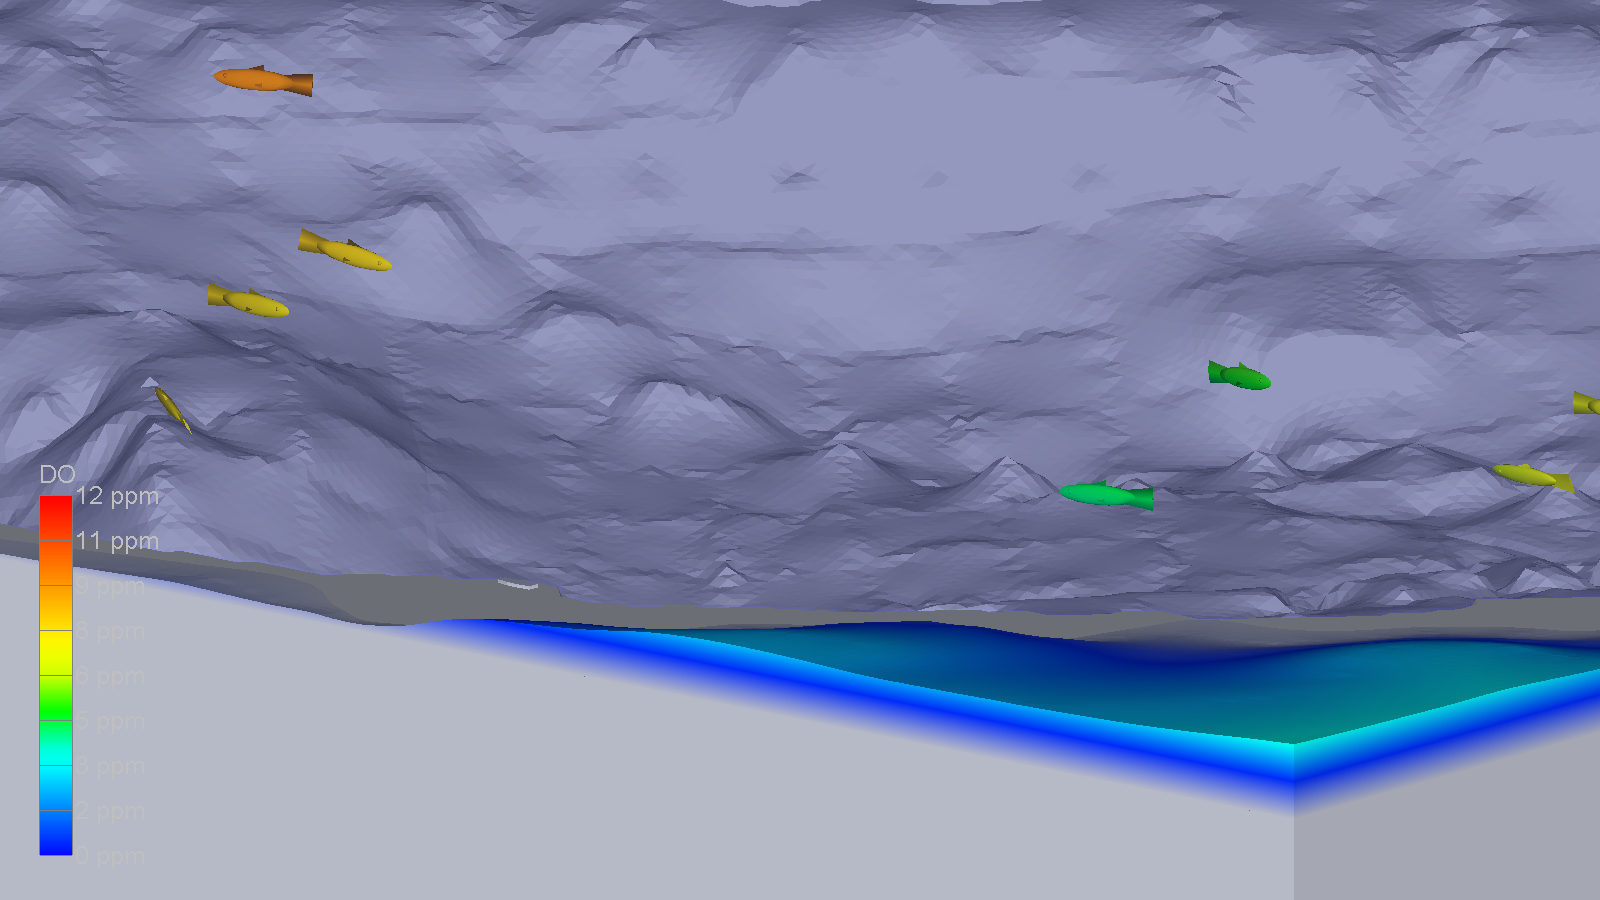
The Saskatchewan Ministry of Environment provided data on one of their lakes which has World Record class rainbow trout that reach 2 meters in length. However, these trout develop in shallow lakes and are in peril in summer months with the prospect of global warming. As the lakes warm, the trout are forced to deeper and cooler waters that have less oxygen. The result is a diminishing layer of habitable water for these amazing behemoths.
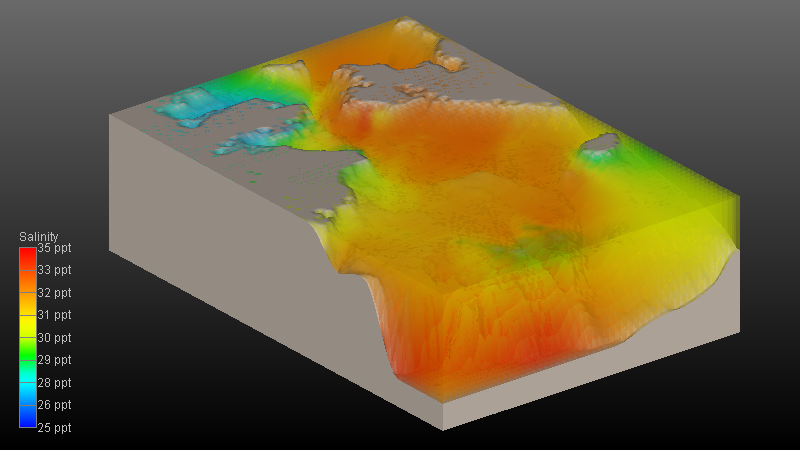
Salinity Distributions in the Chukchi Sea in Fall 1990 viewed from the Northwest. Vertical Exaggeration is 250 above water and 2500 below water.
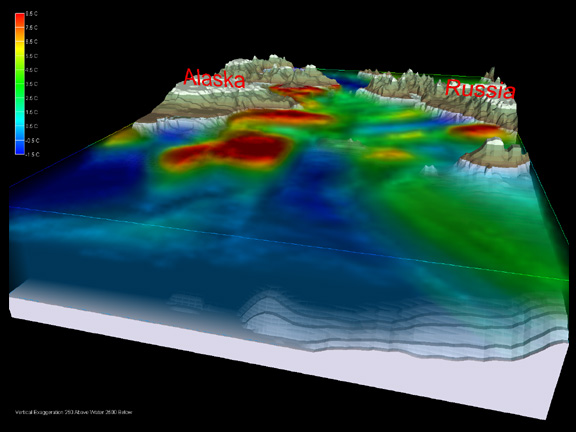
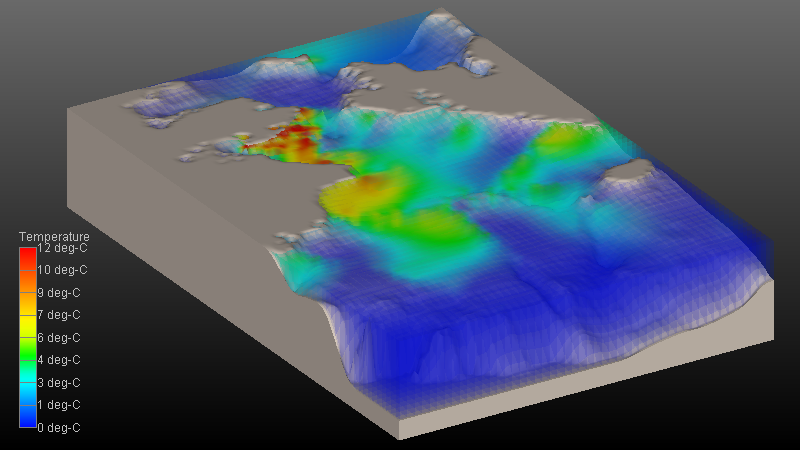
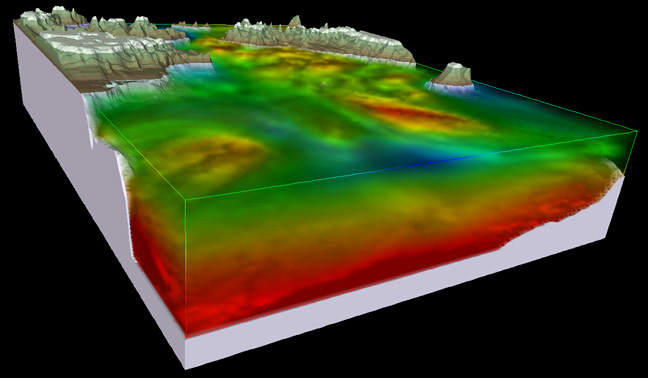
Temperature distributions in the Chukchi Sea in Fall 1990. Data provided courtesy: U.S. NOAA’s Pacific Marine Environmental Laboratory.
Ornis Consult A/S of Copenhagen, Denmark performed this investigation with EVS-PRO as part of their applied marine ecosystem research on the Skagerrak. The Skagerrak is the outer part of the transitional area between the Baltic Sea and the North Sea, and is connected with the North Atlantic through the Norwegian Trench. The distribution of water masses and fronts in the Skagerrak is controlled by a permanent counter-clockwise circulation at depth and a highly dynamic, primarily wind-driven circulation of up to five different surface water masses. EVS’s three-dimensional kriging of CTD data was used to resolve the most stable frontal feature associated with the upwelling structure created by the large-scale circulation.
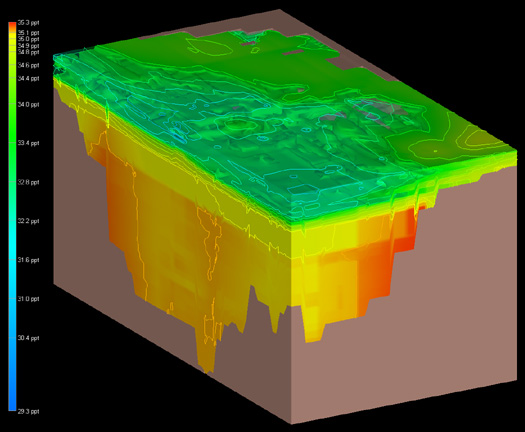
In the figure to the left, regions with salinity values below 33.3 are shown transparent to reveal the shallow water high salinity structures. These areas of high salinity often attract marine life.