Earth Sciences: Geology Software
Earth Volumetric Studio and EnterVol are essential software tools for geologists and geophysicists.
No longer are you limited to 2D fence diagrams and crude guesses. Discover dozens of new ways to interpret your site’s boring logs as a group in 3D.
Earth Volumetric Studio has the ability to build extremely complex geologic models directly from boring logs using indicator kriging in addition to our stratigraphic geologic modeling based on geologic horizons for modeling sites such as Sedimentary Geology.
Earth Volumetric Studio can create complex models that accurately represent subsurface lithology as seen in the 3D Interactive Model below:
Geologic models can definitely be created using a combination of different data sources. The type of geology at the site will determine the approach that must be used and it can vary. Site Geology can be modeled through a variety of processes which can include one or more of the following approaches:
- Modeling of Stratigraphic Horizons
- Indicator Kriging of Lithology Data
- Refinement
- Modeling of Faults and Folds
- Removal of Material from Erosion due to Rivers, Glaciers, etc.
- Removal of Excavations
- Removal of tunnels (circular or user defined cross-sections)
For each of the above steps, the data can come from any combination of cross-sections, geologic borings, topographic surveys, LIDAR, Seismics, Electrical Resistivity Tomography, etc.
Methods 1 & 3 are surface based methods. With both of these, you would need to be able to extract surface information (such as stratigraphic horizons, fault surfaces, or excavation surfaces) from your data.
For indicator kriging based on lithology data, the data is more volumetric in nature, though generally most customers are working with boring logs. Lithology observations can be at the surface, along cross-sections, based on geophysical data or from borings. We use the lithology data to assign lithology (geologic materials) to each cell in a 3D model based on the computing the probabilities for every material observed at the site and selecting the material with the highest probability.
All of these methods can be combined. For example, we would nearly always use topographic data to constrain the grid used for indicator kriging of lithologic data, and oftentimes we have macroscopic horizons that are modeled with stratigraphy within which we use probability based lithologic modeling for more fine-grained material assignment.
As new data is obtained, updating complex models is trivial. The way our software creates models, if you update your data and reload your application, the model will be updated to reflect the new data. The models we create are data driven. There is virtually no drawing involved in creating our 3D volumetric models, though you can draw the 2D & 3D paths along which you wish to cut, tunnel or otherwise subset models.
What we mean by data driven is that the data creates the model, and though the modeler makes many choices about the modeling process, those choices don’t require drawing (in 2D or 3D). The data determines the nature, quality and level of refinement of the model.
We utilize geostatistics to quantify the estimates, confidence and potential variability in that model. With modeling methods 1 & 3, there are multiple estimation methods available for surface creation which include:
- Kriging
- FastRBF
- Spline (thin-plate)
- Natural-Neighbors (with & without gradients)
- IDW (Shepard and Franke/Nielson)
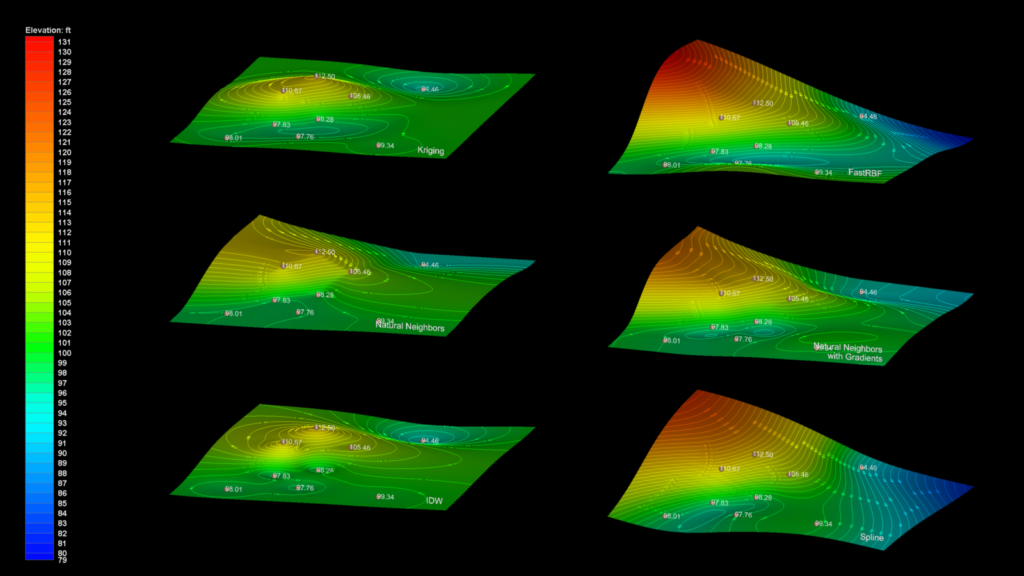
If your surfaces are well defined, meaning that you have lots of data, you will find that all of the methods will give nearly identical results. However, when the surfaces are poorly defined, the different methods will give dramatically different results, and even a single additional synthetic surface point, strategically placed can have a dramatic affect on the surface. The picture below shows 6 different methods being used to model the same surface which is defined with only 9 points (sample locations).
If we had 100 or more fairly uniformly spaced data points, all six methods would result in a nearly identical surface. However, you can see here that the differences range from moderate to dramatic.

