Earth Sciences: Brownfield Development
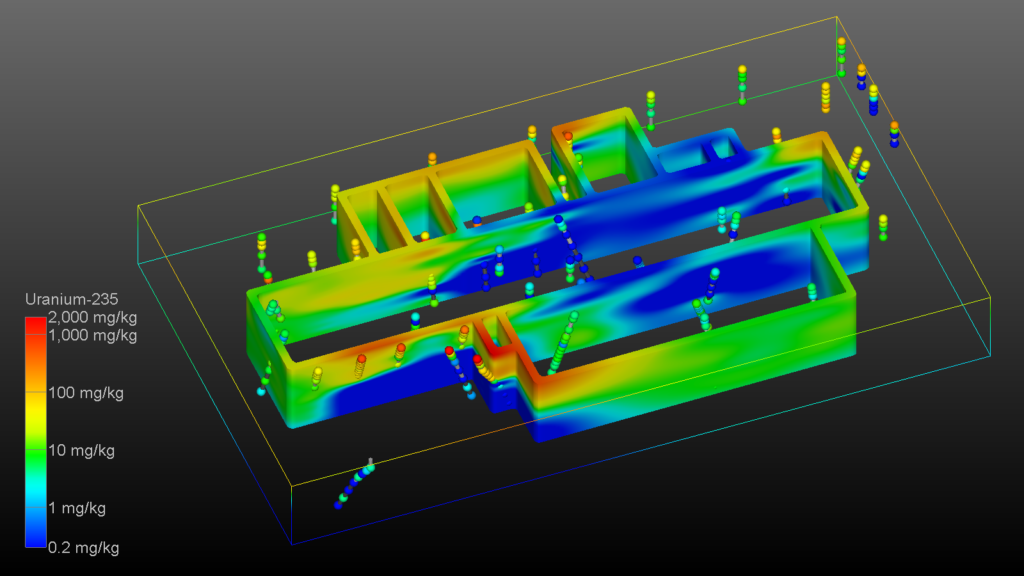
When we are dealing with the redevelopment of Brownfields and other contaminated lands, we are working with data that is collected volumetrically. The simplest definition of volumetric data would be data that is collected at multiple elevations for any X-Y location. To refine that further, we don’t really need the x and y coordinates to be the same, since they would not be if samples were collected along a boring that was not perfectly vertical. The assessment of volumetric is one that is simple and virtually irrefutable. If there is data not only on the surfaces of the model, but also within the model, it must be considered volumetric.
Since it is obvious that virtually all contaminated sites have volumetric data, and therefore must be modeled volumetrically, it is ironic that most “3D” software does not perform volumetric modeling.
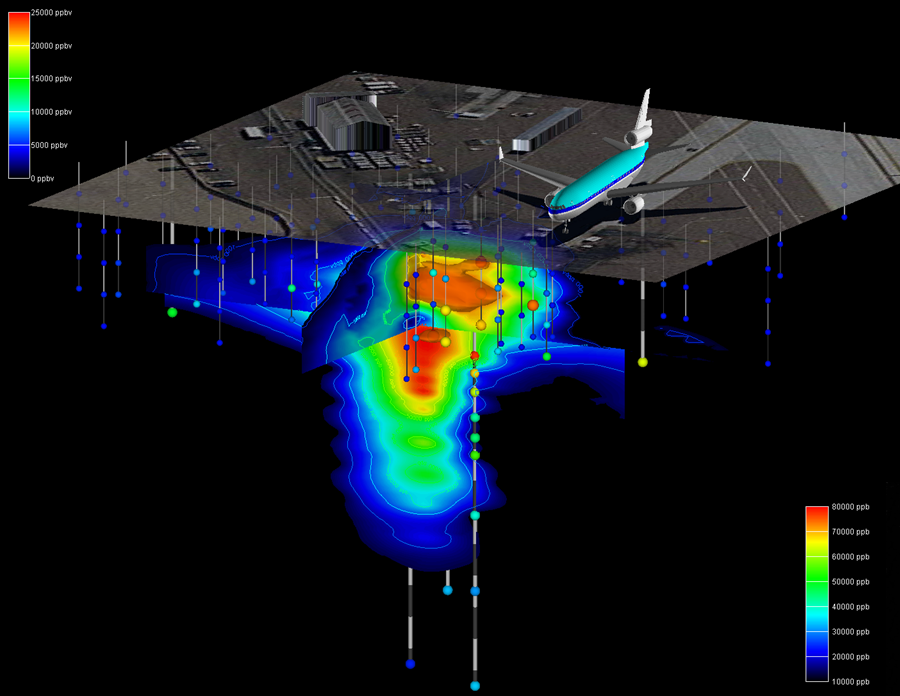
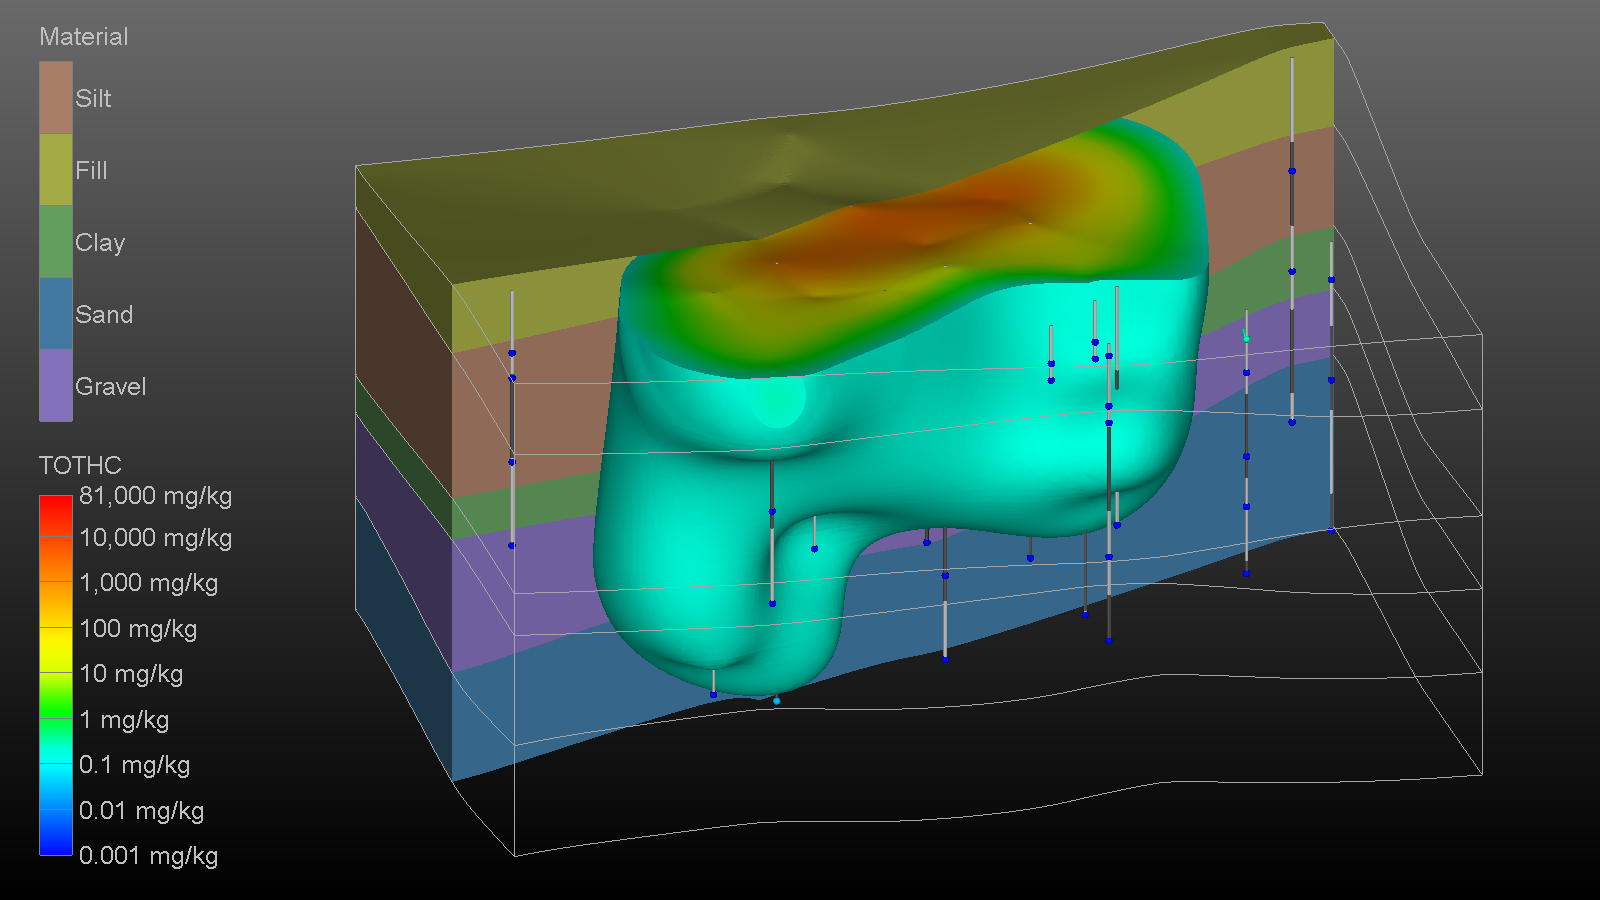
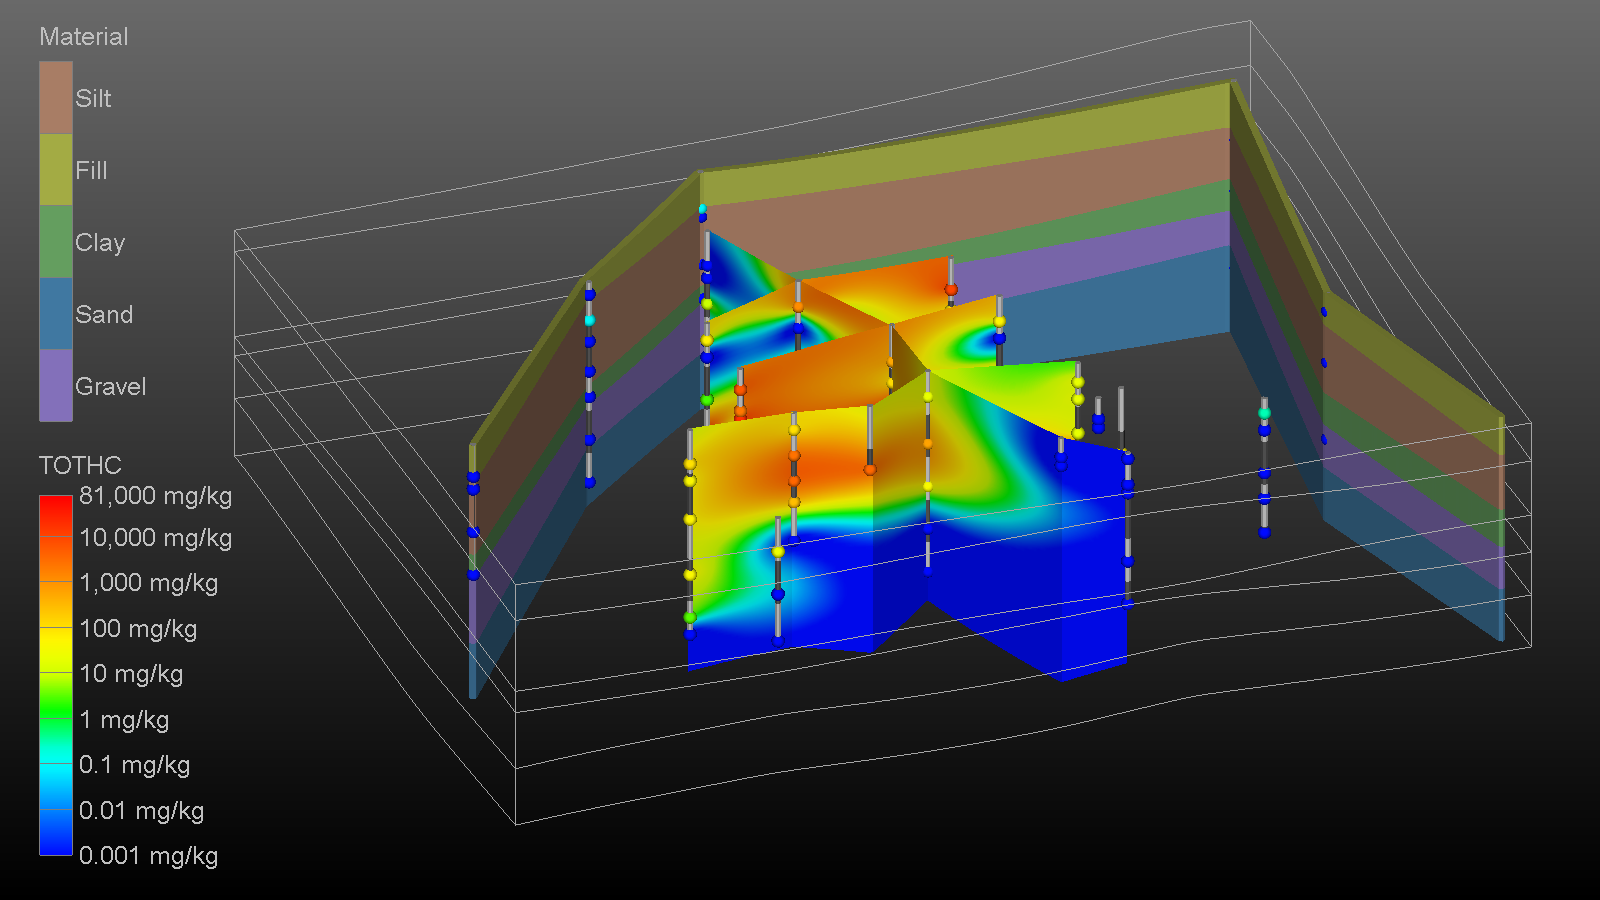
C Tech is known worldwide for our innovative approaches to Soil Contamination modeling, which is a key component of Brownfield Development. Soil contaminant data can often span 6 orders of magnitude or more. Extremely high gradients coupled with limited budgets make it very challenging to develop reasonable models of contaminant distributions. Earth Volumetric Studio and EnterVol both incorporate C Tech’s proven expert systems to conquer the challenging process of developing reasonable volumetric plume models.
Earth Volumetric Studio and EnterVol both provide the ability to present reams of complex geologic and environmental contamination data in a form that is easily comprehended by a judge, jury or the public. In our world where 3D models are commonplace on television, environmental litigators cannot afford to present complex geochemistry data with graphs and charts. You need defensible, data driven models with the realism to win the jury’s minds and the statistical foundation and sound science to stand up to the most rigorous cross examination.
Environmental Modelling: Contamination of the environment, whatever the type, inherently is a three-dimensional geological issue. Not only are the contaminants frequently distributed physically in three dimensions, but the processes by which the contamination was emplaced are almost always three-dimensional in nature. Additionally, designing remedial actions involves consideration of processes that must operate in 3D to be effective.
The use of three-dimensional volumetric modeling methods can be particularly powerful in such situations. Site characterization involves the collection of geologic data, physical samples, and analytical data, all of which have specific 3D spatial positions. Conventional site characterization data represents point or relatively short interval sampling within a much larger geologic volume of material. Modeling is required to create a coherent 3D representation of the distribution of contaminants throughout a site, and the degree of confidence or uncertainty in that representation.
A major consideration, involved in most instances involving environmental contamination and remediation, is the conveying of complex, detailed technical information to non-technical audiences. The public and adjacent land owners are the most obvious examples. Three-dimensional volumetric visualization methods are particularly useful for displaying the relationships among contaminant data, site infrastructure or processes potentially responsible for the contamination, the extent and bounds of inferred (but not yet sampled) contamination, and the remedial processes that may operate to remove or minimize residual contamination after site cleanup is completed. The ability to display these different types of information separately and to integrate them into a coherent visual picture of the entire system are also important within the regulatory and legal arenas.
CAD vs. Data Driven Modelling: Our software is neither CAD (Computer Aided Design) nor graphics software, both of which involve drawing. The models we create are data driven. There is virtually no drawing involved in creating our 3D models, though you can draw the 2D & 3D paths along which you wish to cut, tunnel or otherwise subset models. What we mean by “data driven” is that the data creates the model, and though the modeler makes many choices about the modeling processes, those choices don’t require drawing. The data determines the nature, quality and level of refinement that should be employed in the model, and we utilize geostatistics to quantify the estimates, confidence and potential variability in that model.
We make it easy to incorporate 3D CAD models, GIS data, aerial photos and/or photographic textures on geologic materials, but we consider this additional data as model enhancements or annotations, since they don’t influence the volume of contaminant plumes or the distribution of contaminants in a geologic unit.
Volumetric Modelling Justification: We have always believed that the rationale and requirement for 3D Volumetric modeling is stunningly obvious:
- The sites we are modeling are volumetric
- The contaminant spills are volumetric
- The data we collect to characterize the contamination is volumetric
- All remediation methods, ranging from in-situ bioremediation, to pump-and-treat, to excavation are all volumetric.
Analytically Guided Site Assessment: Remediation cannot begin without proper site characterization. In the U.S., many sites are tagged as Brownfields based on their history and/or obvious site characteristics, such as rusted oil barrels strewn about. However, many of these sites have not had any actual site characterization, and therefore their true status and degree of contamination may be unknown. Even when limited characterization has been performed, the hottest spots on the site and the full nature of the contamination is rarely known. For over 20 years, C Tech’s DrillGuide© technology has been used to quantify site uncertainty, and determine where it is most efficient to collect additional samples to reduce that uncertainty and the corresponding statistical variation in the volume of the estimated contaminant plume. We refer to this process as analytically guided site assessment, and it has been proven to provide the lowest cost data collection and highest quality characterization of site contamination.
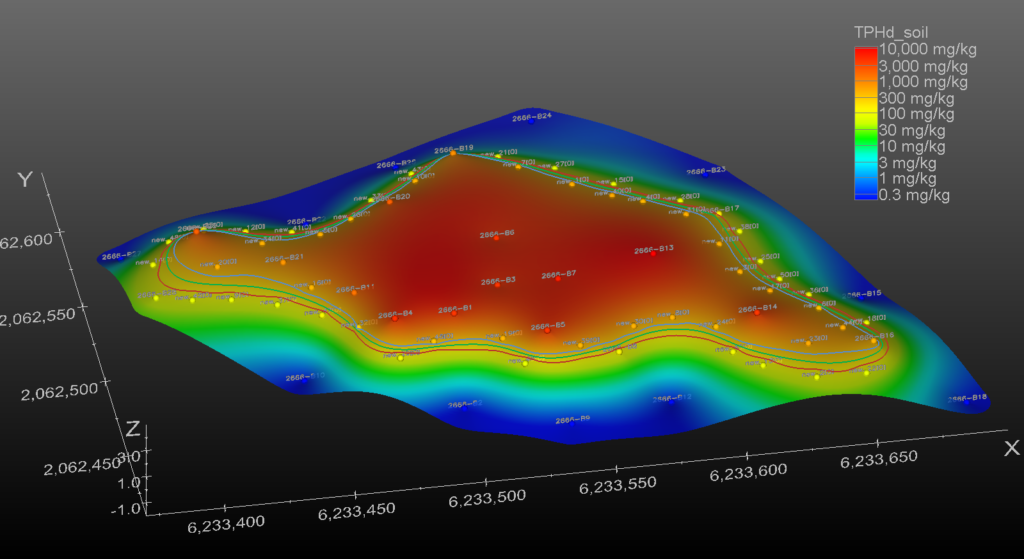
A DrillGuide© analysis uses geostatistics (kriging) to analyze all currently available samples at the site. When kriging is used to perform estimation, the standard deviation throughout the site is also determined. Standard deviation will be zero at the sampled locations and will increase as you move into areas away from measured samples. DrillGuide© assesses the distribution of predicted concentrations and standard deviations to determine the locations at the site where the concentration is predicted to be high, but the confidence in that prediction is low. It selects the optimal location for the next sample using this information and then creates a synthetic sample for that location and repeats the process.
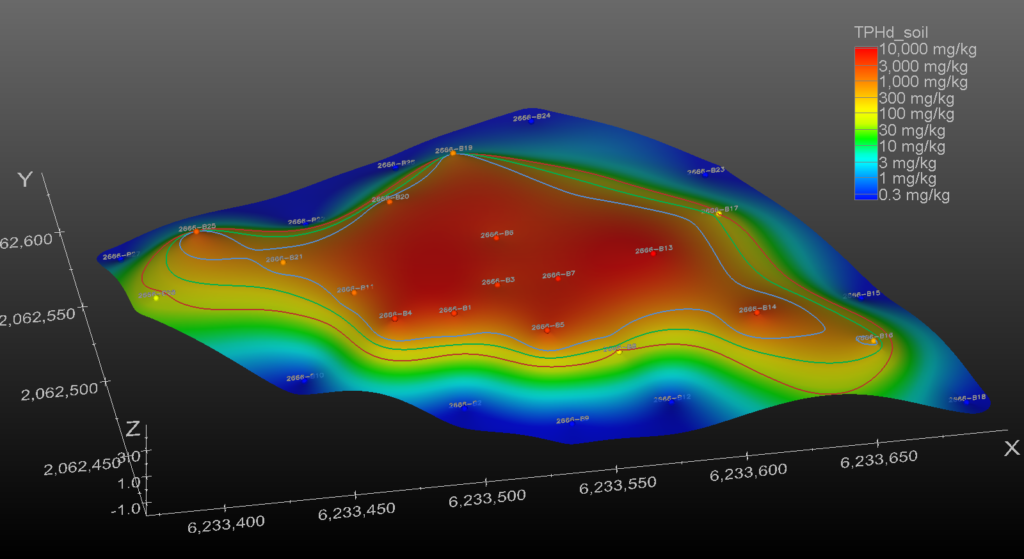
To help explain this complex process, we present two images from a two-dimensional DrillGide© analysis. We can perform this analysis in 2D or 3D, but we present the results from a 2D analysis here since it is simpler and a bit easier to understand. Below is the 2D characterization of a site with Diesel contamination. The surface is colored by concentration and there are three contour lines. The outer dark red line is the largest the 200 mg/kg plume is predicted to be with an 80% confidence, and the inner blue line is the smallest it might be with an 80% confidence. The green line in between is the nominal plume. In a well characterized site, these three lines would be nearly coincident.

