The color of the ports on a module provides an immediate visual cue about the type of data they accept or output. Understanding these colors and types helps in quickly assessing a module’s function and ensuring you are making valid connections within the Application Network.
Port Types
Each port type is designed to handle a specific kind of data. The primary types are listed below.
| Port Type | Color Name | Color | Description |
|---|---|---|---|
| Renderable Object | Red | 
| This port handles renderable geometry and connects to the Viewer to display objects like isosurfaces, axes, or legends. It contains the fields, data, and rendering information necessary for visualization. |
| Field | Blue | 
| This is the most common port type, used to pass datasets - such as grids with nodal or cell data - between the modules that create, subset, or modify them. |
| Realization Field | Light Blue | 
| This is a special variant of the Field port used in stochastic modeling workflows to pass data for geostatistical realizations. |
| String | Olive Green | 
| This port is used to pass text data, which can range from single words and phrases to full file names and paths. |
| Geologic Legend Information | Dark Green | 
| This data port contains material names and related information from geology modules, often used to populate legends. |
| Vistas Data | Brown | 
| This port is specifically used to pass geologic surface information to Groundwater Vistas for initializing MODFLOW models. |
| Number | Green | 
| This port passes a single real number between modules. |
| Date-Time | Yellowish Green | 
| This port passes date and time information. |
| View | Light Maroon | 
| This port is an output from the viewer that passes the entire scene’s information, used by modules that export the viewer contents. |
Port Subtypes
In addition to the primary colors, some ports feature one or more small colored dots. These dots indicate port subtypes, which provide more specific information about the data and enforce stricter connection rules. A connection is only valid if the output port includes all subtypes on the input port. This system prevents invalid connections, such as connecting a module that expects cell-based data to a port that only provides node-based data.
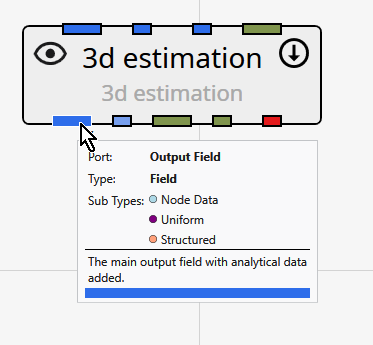
Below is an example of the output port for the 3d estimation module, which has three subtypes: Node Data, Uniform, and Structured.
The subtypes are grouped by their primary port category:
| Category | Subtype | Color | Description |
|---|---|---|---|
| Field Subtypes | |||
| These subtypes describe the structure of the grid or the nature of the data within a Field object. | Geology | Goldenrod | Indicates that the field contains data representing geologic materials or stratigraphy, typically as integer material IDs. |
| Structured | Light Salmon | Indicates that the field is a structured grid, where the grid points are arranged in a regular, logical pattern (i.e., an i, j, k lattice). | |
| Uniform | Purple | A more specific version of a structured grid, indicating that the spacing between grid points is constant along each axis. | |
| Node Data | Light Blue | Indicates that the data values in the field are associated with the nodes (vertices) of the grid. | |
| Cell Data | Green | Indicates that the data values in the field are associated with the cells of the grid. | |
| Number Subtypes | |||
| These subtypes specify the intended use for a numeric value that is passed between modules. | Z Scale | Pink | Represents a numeric factor for vertical exaggeration, used to stretch or compress the Z-axis in the 3D viewer. |
| Explode | Gold | Represents a numeric factor that controls the “explode” distance, which separates components of a model for better visibility. | |
| String Subtypes | |||
| These subtypes specify that the string data represents a path to a particular kind of file. | Filename | Blue | A generic file path. |
| Analytical File | Green Yellow | A path to a file containing analytical chemistry data. | |
| Stratigraphy File | Light Goldenrod Yellow | A path to a file defining stratigraphic layers or surfaces. | |
| Lithology File | Dark Gray | A path to a file defining lithologic materials and their properties. |
Identifying Ports
To identify which port on a module corresponds to a specific item in the documentation, follow this order:
- Input Ports are read from top to bottom on the left side of the module, then left to right on the top side.
- Output Ports are read from top to bottom on the right side of the module, then left to right on the bottom side.
You can also hover your cursor over any port to see a tooltip with its name and data type details.