When you double-click an output port on a any module in the Application Network, the Properties window displays detailed information and settings for that specific port. While the properties shown vary depending on the type of data the port provides, certain elements are common to all ports.
At the top of the window, a Switch to Module Properties button provides a convenient way to navigate back to the properties of the module that owns the port.
Common Port Properties
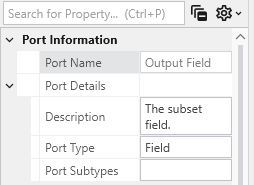
All output ports display a Port Information section with the following properties:
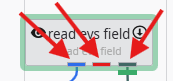
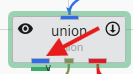
Renderable Object Port Properties In Earth Volumetric Studio, a red port is a Renderable Object port. It outputs a visual object—such as a surface, a set of points, or a volume—that can be displayed in a viewer. By editing the properties of this port, you can control every aspect of how the object is visualized in the 3D scene. See the Visualization Fundamentals section for additional details on rendering options.
Field Port Properties In Earth Volumetric Studio, a blue port is a Field Port. It is the most common port type and is responsible for passing grid structures and their associated data between modules. A “field” contains the geometry (nodes and cells) as well as any data values defined on that grid, such as analytical results or material properties.
Subsections of Port Properties
Renderable Object Port Properties
In Earth Volumetric Studio, a red port is a Renderable Object port. It outputs a visual object—such as a surface, a set of points, or a volume—that can be displayed in a viewer. By editing the properties of this port, you can control every aspect of how the object is visualized in the 3D scene. See the Visualization Fundamentals section for additional details on rendering options.
To access these properties, you can double-click on a red port in the Application Network, which will load its settings into the Properties window.
Port Information
General information about the port as described in the Port Properties topic.
General Properties
This is the primary section for controlling the object’s appearance, coloring, and visibility in the 3D scene.
Property
Description
Visible
A master toggle to show or hide the object in the viewer.
Pickable
Determines if the object can be selected in the viewer using the probe tool (Ctrl + Left-click). Disabling this can be useful for large, transparent objects that might interfere with selecting objects behind them.
Opacity
Controls the transparency of the object. A value of 100% makes the object fully opaque, while 0% makes it completely invisible.
Faces To Display
Controls which faces of a 3D object are rendered.
Display All: Renders both the front and back sides of faces.
Camera Facing: Renders only the faces pointing toward the camera. This is useful for making closed transparent objects look correct and can improve performance.
Facing Away: Renders only the faces pointing away from the camera.
Color By
Determines the source of the object’s color.
Nodal Data: Colors the object based on data values at the nodes, often resulting in smooth color gradients.
Cell Data: Applies a uniform color to each entire cell based on its data value.
Solid Color: Applies a single, uniform color to the entire object.
Node Data / Cell Data
If coloring by data, these dropdowns let you select which specific data component to use for coloring.
Vector Component / Use Vector Magnitude
If the selected data is a vector, this allows you to color the object by a single component or by the vector’s overall magnitude.
Node/Cell Data Datamap
Opens the datamap editor to define the mapping between data values and colors. See the Datamaps topic for more information.
Object Color
If Color By is set to Solid Color, this control allows you to select the specific color for the object.
Object Secondary Color
This color is primarily used for drawing the outlines of cells when “Hide Cell Outlines” is disabled.
Normals Generation
Affects how lighting is calculated on surfaces.
Default: Selects the best method based on the input data type.
Cell Normals: Results in flat shading with hard transitions between cells.
Point Normals: Averages normals at each point, creating a smooth, continuous appearance.
Rendering Priority
A numeric value that influences the drawing order of objects. Objects with higher numbers are drawn later (on top of others).
Export Properties
This section contains settings related to exporting the application.
Property
Description
Exclude From Compression
If checked, this object’s geometry will not be compressed when exporting to a C Tech Web Scene. This preserves full precision but can result in a significantly larger file size.
Advanced Properties
These settings provide fine-grained control over geometry processing and rendering. They are intended for advanced users and should generally be left at their default values unless you are addressing a specific rendering issue.
Rendering Modes
This section controls how different geometric components of the object are displayed.
Property
Description
Point/Line/Surface/Volume/Bounds Display Mode
Each dropdown allows you to change the rendering style for a specific component (e.g., render a surface as a wireframe (Lines) or display points as spheres (Glyphs)).
Hide Cell Outlines
Toggles the visibility of the wireframe edges of the cells that make up the object.
Surface Properties
These properties control how the object’s surface interacts with light in the scene. They are intended for advanced users and should generally be left at their default values unless you are addressing a specific rendering issue.
Property
Description
Ambient
Controls how much ambient light the surface reflects (the object’s color in the absence of direct light).
Diffuse
Controls how much light the surface reflects from direct light sources, determining the primary illuminated color.
Specular
Controls the color of specular highlights (bright spots where light reflects directly toward the camera).
Gloss
Controls the size and intensity of specular highlights. Higher values create smaller, sharper highlights, making the surface appear shinier.
Point And Line Properties
This section contains settings that apply specifically to objects composed of points or lines.
Property
Description
Line Style
Sets the pattern for lines.
Solid: A continuous, unbroken line.
Dashed: A line made of a series of short segments.
Dotted: A line made of a series of dots.
**Dashed-Dotted: **A combination of the Dashed and Dotted line styles.
Line Thickness
Controls the width of lines in pixels. A value of 0 uses a default, fast-rendering single-pixel line.
Glyph Size
If points or lines are rendered as glyphs (e.g., quads), this controls their size.
Smooth Lines
Toggles anti-aliasing for lines. When enabled, lines will appear smoother with less jaggedness.
Texture Settings
If the object has a texture applied, these properties control how it is mapped and rendered. They are intended for advanced users and should generally be left at their default values unless you are addressing a specific rendering issue.
Property
Description
Interpolation
Determines how the texture is sampled when magnified or minified. Bilinear (default) averages the four nearest texels for a smooth but potentially blurry appearance.
Tile
Controls the texture’s behavior at its boundaries. Clamp causes the edge pixels to be stretched to fill the rest of the surface.
Blending
Defines how the texture’s color is combined with the object’s underlying color. Replace causes the texture’s color to completely overwrite the object’s original color.
Type
Relates to the use of mipmaps. Single Level indicates that only the original, full-resolution texture is used, without any lower-resolution versions for distant objects.
Field Port Properties
In Earth Volumetric Studio, a blue port is a Field Port. It is the most common port type and is responsible for passing grid structures and their associated data between modules. A “field” contains the geometry (nodes and cells) as well as any data values defined on that grid, such as analytical results or material properties.
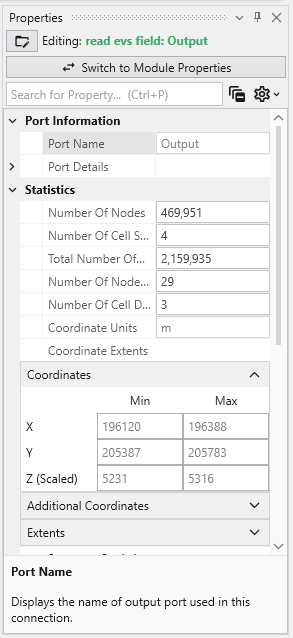
To access the properties of a Field Port, you can double-click on any blue port in the Application Network. This will load its settings and summary information into the Properties window.
Port Information
General information about the port as described in the Port Properties topic.
Statistics
This section gives a high-level summary of the contents of the field.
Property
Description
Number Of Nodes
The total count of nodes (points) that define the field geometry.
Number Of Cell Sets
The number of distinct groups of cells. Cell sets are often used to represent different geologic layers or materials.
Total Number Of Cells
The total count of all cells across all cell sets in the field.
Number Of Node Data / Number Of Cell Data
The count of different data components attached to the nodes or cells.
Coordinate Units
The measurement unit for the grid’s coordinates (e.g., meters, feet).
Coordinate Extents
The overall dimensions (X, Y, Z) of the grid’s bounding box.
Coordinates
This table displays the minimum and maximum coordinate values for the X, Y, and Z axes, defining the spatial bounding box of the grid. The Z (Scaled) value reflects the coordinates after any global Z Scale has been applied.
Summary Statistics
This section provides a quick statistical overview of a selected data component within the field.
Property
Description
Data Component
A dropdown menu to select which data component you wish to analyze.
Data Units
The measurement unit for the selected data component.
Is Log
A checkbox indicating if the data is on a logarithmic scale.
Data Min / Data Max
The minimum and maximum values for the selected data component.
Histogram
A small histogram plot provides a quick visual summary of the data’s distribution.
Open Statistics Window
This button launches a separate, more detailed window for in-depth statistical analysis.
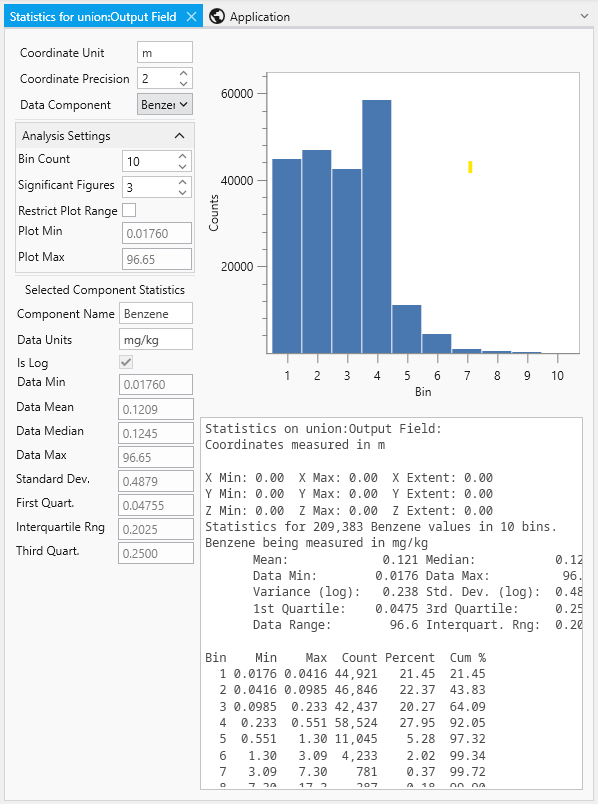
The Statistics Window
The Statistics Window provides a comprehensive and interactive environment for analyzing the data within a field. It is composed of several panels that allow you to customize the analysis and view detailed statistical results, both graphically and textually.
Panel / Component
Description
Analysis Settings
Located in the top-left corner, this panel allows you to control how the statistical analysis is performed and displayed.
Bin Count: Adjusts the number of columns in the histogram to change the granularity of the distribution plot.
Significant Figures: Controls the precision of the displayed numerical results.
Restrict Plot Range: When enabled, allows you to manually define the minimum and maximum values for the analysis.
Selected Component Statistics
Located below the analysis settings, this panel presents key statistical metrics for the chosen data component.
Data Mean: The average value.
Data Median: The middle value of the dataset.
Standard Dev.: The standard deviation, a measure of data dispersion.
Interquartile Rng.: The range between the first and third quartiles.
Histogram Plot
The main area on the right, providing a clear visual representation of the data’s distribution by showing the number of data values (Counts) that fall into each bin.
Statistics Summary
A text-based report below the plot, offering a summary of coordinate extents and a detailed breakdown of the statistics.
Bin Data Table
Located at the bottom, this table lists the specific data for each bin, including its minimum and maximum range, the count of values it contains, and the cumulative percentage of the total data set.