Field Port Properties
In Earth Volumetric Studio, a blue port is a Field Port. It is the most common port type and is responsible for passing grid structures and their associated data between modules. A “field” contains the geometry (nodes and cells) as well as any data values defined on that grid, such as analytical results or material properties.
To access the properties of a Field Port, you can double-click on any blue port in the Application Network. This will load its settings and summary information into the Properties window.
Port Information
General information about the port as described in the Port Properties topic.
Statistics
This section gives a high-level summary of the contents of the field.
| Property | Description |
|---|---|
| Number Of Nodes | The total count of nodes (points) that define the field geometry. |
| Number Of Cell Sets | The number of distinct groups of cells. Cell sets are often used to represent different geologic layers or materials. |
| Total Number Of Cells | The total count of all cells across all cell sets in the field. |
| Number Of Node Data / Number Of Cell Data | The count of different data components attached to the nodes or cells. |
| Coordinate Units | The measurement unit for the grid’s coordinates (e.g., meters, feet). |
| Coordinate Extents | The overall dimensions (X, Y, Z) of the grid’s bounding box. |
Coordinates
This table displays the minimum and maximum coordinate values for the X, Y, and Z axes, defining the spatial bounding box of the grid. The Z (Scaled) value reflects the coordinates after any global Z Scale has been applied.
Summary Statistics
This section provides a quick statistical overview of a selected data component within the field.
| Property | Description |
|---|---|
| Data Component | A dropdown menu to select which data component you wish to analyze. |
| Data Units | The measurement unit for the selected data component. |
| Is Log | A checkbox indicating if the data is on a logarithmic scale. |
| Data Min / Data Max | The minimum and maximum values for the selected data component. |
| Histogram | A small histogram plot provides a quick visual summary of the data’s distribution. |
| Open Statistics Window | This button launches a separate, more detailed window for in-depth statistical analysis. |
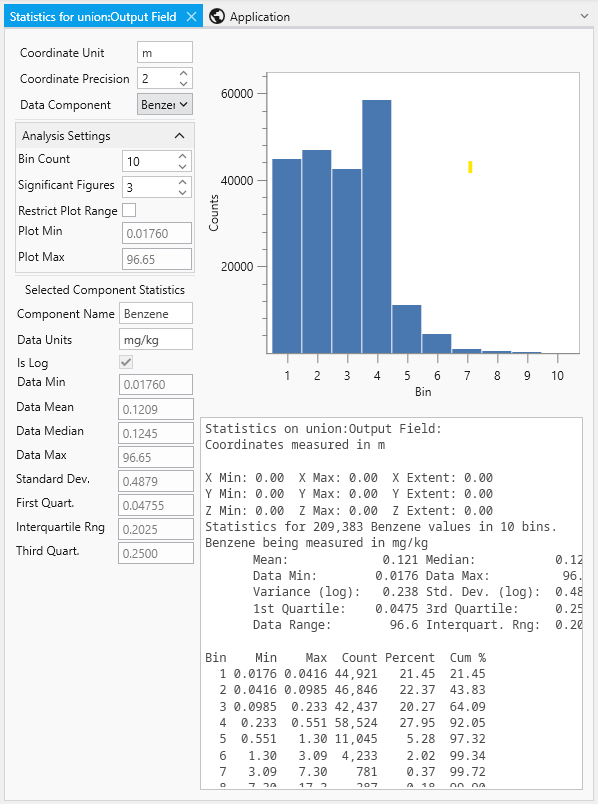
The Statistics Window
The Statistics Window provides a comprehensive and interactive environment for analyzing the data within a field. It is composed of several panels that allow you to customize the analysis and view detailed statistical results, both graphically and textually.
| Panel / Component | Description |
|---|---|
| Analysis Settings | Located in the top-left corner, this panel allows you to control how the statistical analysis is performed and displayed.
|
| Selected Component Statistics | Located below the analysis settings, this panel presents key statistical metrics for the chosen data component.
|
| Histogram Plot | The main area on the right, providing a clear visual representation of the data’s distribution by showing the number of data values (Counts) that fall into each bin. |
| Statistics Summary | A text-based report below the plot, offering a summary of coordinate extents and a detailed breakdown of the statistics. |
| Bin Data Table | Located at the bottom, this table lists the specific data for each bin, including its minimum and maximum range, the count of values it contains, and the cumulative percentage of the total data set. |