The Datamap Editor is the primary tool in Earth Volumetric Studio for creating and customizing the mapping between your data values and the colors used to represent them in a visualization. It provides a powerful, interactive interface to control color gradients, data ranges, and scaling, allowing you to effectively highlight the features of interest in your data.
You can access the Datamap Editor by clicking the Edit button next to the Node Data Datamap or Cell Data Datamap properties in a module’s rendering settings.
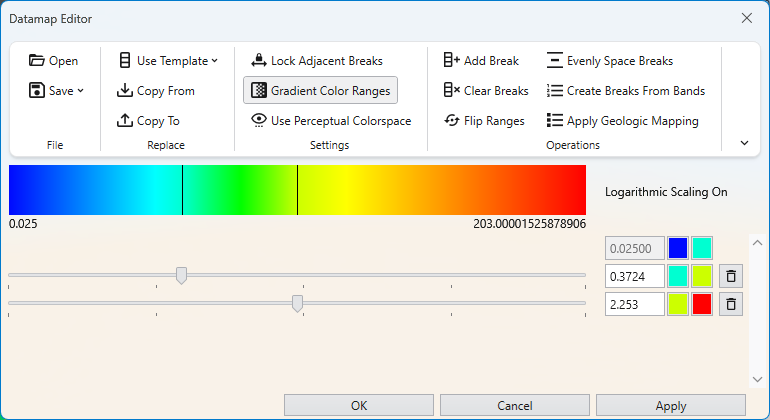
The editor is composed of three main areas: the toolbar at the top, the color ramp preview in the middle, and the color break editor at the bottom.
Toolbar
The toolbar provides access to file operations, settings, and tools for manipulating the datamap.
File and Replace Operations
| Operation | Description |
|---|---|
| Open | Allows you to load a previously saved datamap configuration from a .CTDmap file, enabling you to reuse complex color schemes across different projects and models. |
| Save | This dropdown menu provides two distinct ways to save the current datamap configuration to a .CTDmap file.
|
| Use Template | Applies one of the default datamap templates, such as Default Node Map, Linear Grayscale, or perceptually uniform scientific colormaps. |
| Copy From | Opens a dialog to copy a datamap from another module in your application, allowing you to select a specific source and apply its datamap to the current module. |
| Copy To | Performs the reverse of Copy From. It allows you to apply the current datamap’s configuration to one or more selected modules and ports. |
Settings
| Setting | Description |
|---|---|
| Lock Adjacent Breaks | This toggle locks the colors between breaks. When enabled, changing the color of a break point will also update the adjacent break point in the next range, ensuring a continuous color gradient. |
| Gradient Color Ranges | This toggle controls whether to use smoothly changing colors. When enabled, colors blend seamlessly between break points. When disabled, each range is filled with a single, solid color. |
| Use Perceptual Colorspace | This option switches the color interpolation method to a “visual perceptual colorspace,” which can produce gradients that are perceived as more uniform and natural by the human eye. |
Operations
| Operation | Description |
|---|---|
| Add Break | Adds a new break position to the datamap, allowing you to introduce a new color and data value point to refine your color gradient. |
| Evenly Space Breaks | Redistributes all existing color breaks linearly across the full data range, creating a uniform gradient. |
| Clear Breaks | Removes all intermediate color breaks, leaving only the start and end points and creating a simple, two-color gradient. |
| Create Breaks From Bands | Automatically creates new color breaks at the exact data values used by another module (like isolines), ensuring color changes align perfectly with contour lines or other banded visualizations. |
| Flip Ranges | Reverses the color ramp, so that the color previously at the maximum value is now at the minimum value, and vice-versa. |
| Apply Geologic Mapping | Designed for categorical data, this function creates a series of discrete, solid color ranges corresponding to the integer IDs used to represent different geologic materials. |
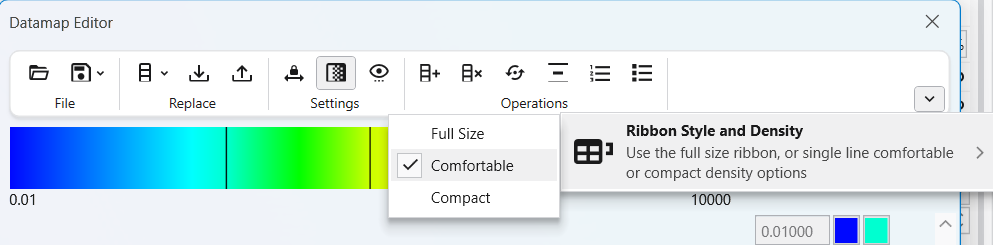
The toolbar also has similar options to the EVS Main Toolbar in terms of display style and density.
Color Ramp and Break Editor
This is the main interactive part of the editor where you define the datamap.
Color Ramp Preview: The large horizontal bar shows a preview of the final datamap. It displays the colors and the smooth transitions between them, based on the color breaks you have defined below it. The minimum and maximum data values of the current range are displayed at the ends of the ramp.
Logarithmic Scaling Indicator: Text such as “Logarithmic Scaling On” will appear to the right of the color ramp. This indicates that the datamap is currently processing the data on a logarithmic scale. This is essential for effectively visualizing data that spans several orders of magnitude, as it allocates more color variation to the lower-end values.
Color Break Editor: This section is where you define the specific points of your datamap. The datamap is composed of one or more color intervals, and the points that define the start and end of these intervals are called color breaks. Within each interval, the color transitions in a linear gradient based on the data values and colors set at its start and end breaks. A key feature of the editor is that the color at the end of one interval does not need to be continuous with the color at the start of the next. By disabling the Lock Adjacent Breaks setting, you can create a “hard break,” or an abrupt change in color at a specific data value. This is useful for visually separating distinct data ranges. Furthermore, the length of each interval can be adjusted independently, allowing you to create a non-linear datamap by stretching or compressing the color gradient across different parts of the data range.
Each color break is represented by a row in the editor, which includes:
| Component | Description |
|---|---|
| Data Value Input Box | Allows for precise numeric entry of the data value for the break. |
| Color Swatch | Opens a color picker to set the color for the break. |
| Slider | Provides interactive adjustment of the data value for the break. |
| Delete Button | A trash can icon to remove the break. |