The Output Log window is a critical tool for monitoring the real-time status of Earth Volumetric Studio. It provides a chronological and hierarchical record of events, module execution details, warnings, and diagnostic messages. Whether you are running a complex analysis or troubleshooting an unexpected issue, the Output Log offers valuable insight into the application’s internal processes.
Key Features
The Output Log window includes several features to help you control and interpret the information it displays.
Logging Level
This dropdown menu controls the verbosity of the log messages, allowing you to filter the information to suit your needs.
| Level | Description |
|---|---|
| Normal | This is the default level. It displays standard operational messages, such as the start and completion of major processes, file loading information, and general warnings. |
| Include Diagnostics | This level includes all “Normal” messages plus additional diagnostic information. It is useful for troubleshooting problems without being overwhelmed by excessive detail. |
| Detailed Diagnostics | This is the most verbose level, providing in-depth information for advanced debugging. It may include performance timings, internal state data, and other technical details primarily useful for developers or advanced users. |
Clear Button
Clicking the Clear button will immediately remove all current entries from the log display. This is useful for creating a clean slate before running a new process that you want to monitor closely.
Log Content Area
The main area of the window displays the log entries themselves, which have a rich, structured format:
| Feature | Description |
|---|---|
| Hierarchical View | Entries are organized in a tree-like structure. A triangle icon ( ˃ ) indicates a collapsible entry that contains more detailed sub-entries. Clicking it expands the view to show the nested information. |
| Informational Icons | An icon next to a message provides a visual cue about its nature. For example, the ‘i’ in a circle denotes an informational message, while a yellow sign with an exclamation mark indicates a warning. |
| File Links | File paths within the log are often rendered as clickable links. Clicking a link will open File Explorer and highlight the file. |
| Open File | A small folder icon next to an entry allows you to open the file directly in its associated application. For example, installing the Standalone C Tech 3D Scene Viewer will cause exported CTWS files in the log to have that icon, and clicking will open the file in the 3D Scene Viewer automatically. |
Understanding Log Entries
The Output Log provides a step-by-step account of module execution. For example, when running a 3D estimation, you might see entries detailing each phase of the process:
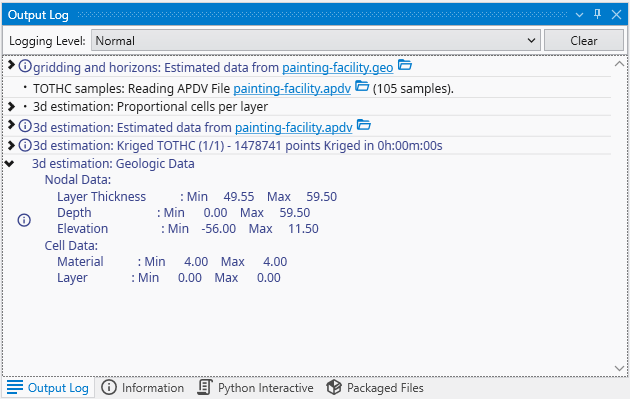
- Data Loading: The log shows which files are being read and how many data points are found (e.g., “Reading APDV File… (105 samples)”).
- Process Execution: It reports the status of major calculations, such as kriging, including performance metrics like the time taken to complete the operation.
- Summary Statistics: After a process completes, modules often output summary statistics directly to the log. As shown in the image, an expanded entry for “Geologic Data” displays the minimum and maximum values for Nodal Data (like Layer Thickness) and Cell Data (like Material), providing a quick quality check of the results.