The Information Window provides detailed, contextual output from various components within Earth Volumetric Studio. Unlike the Output Log, which primarily displays text-based messages and system logs, the Information Window is designed to present data in a structured, readable, and often interactive format.
It is commonly used by modules to display analysis reports or to show detailed data about a specific point in the model that a user has “picked” in the Viewer (via Ctrl+Left Mouse Click).
Window Components
The Information Window has a simple and functional layout.
| Component | Description |
|---|---|
| History Dropdown | At the top of the window, the History dropdown maintains a list of recently generated reports and data views. Each time a module or action sends new output to the window, a new entry is added to this list, timestamped for easy identification. You can select any item from this list to recall that specific information. |
| Clear Button | The Clear button removes all entries from the history, providing a clean slate. |
| Content Area | The main area of the window displays the content itself. The format of this content is determined by the module or action that generated it. |
Examples of Use
The content displayed in the Information Window is highly contextual. Below are two common examples.
Module Analysis Reports
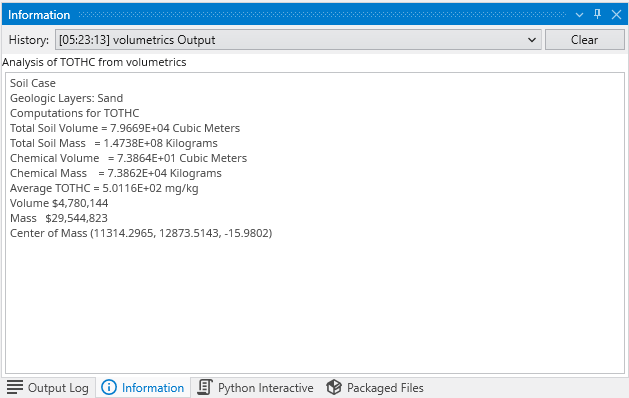
Many analysis modules, such as volumetrics, send their summary reports to the Output Window. This provides a clean, organized summary of complex calculations, which can be easier to read than plain text logs.
In the example above, the output from a volumetrics analysis includes calculated values for soil volume, mass, chemical volume, average concentration, and cost, all presented in a clear, structured format.
Data from Picking
One of the most powerful uses of the Information Window is to display detailed data when you “pick” a location in the Viewer window via Ctrl+Left Mouse Click. This provides an in-depth look at the data values at a specific point in your model.
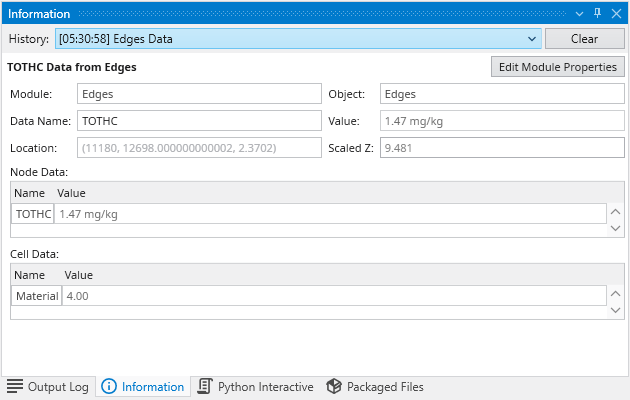
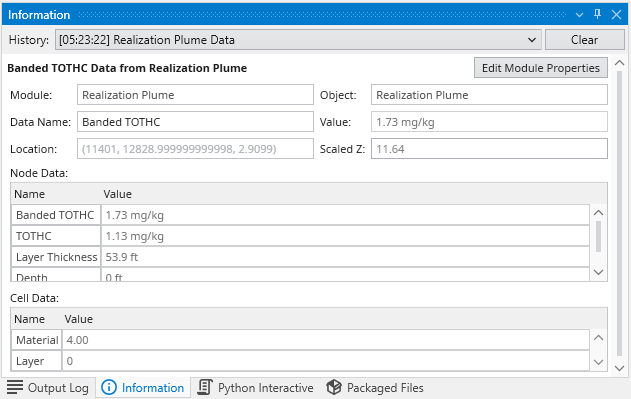
The example above shows the data displayed after picking a point on a plume. The window can contain structured UI elements, including:
| Element | Description |
|---|---|
| Header Information | Displays the source module (Realization Plume), the object name, the data type (TOTHC) that the object is colored by, and the precise X, Y, Z location of the pick. |
| Interactive Controls | Buttons like Edit Module Properties may appear, providing a direct shortcut to open the settings for the source module, allowing for quick adjustments. |
| Data Tables | The information is organized into tables, such as “Node Data” and “Cell Data”, which list the interpolated values for all available parameters (e.g., concentration, layer thickness, material type) at the selected location. |