group objects group objects is a renderable object that contains other subobjects that have the attributes that control how the rendering is done. Unlike DataObject, group objects does not include data. Instead, it is meant to be a node in the rendering hierarchy that groups other DataObjects together and supplies common attributes from them. This object is connected directly to one of the viewers (for example, Simpleviewer3D) or to another DataObject or to group objects. A group objects is included in all the standard viewers provided with the EVS applications chooses.
group objects to 2d overlay The group objects to 2d overlay moduleprovides a module that applies any connected module’s output to the viewer’s 2D overlay. Objects in the overlay are not transformed (rotated, zoomed, panned). These objects are locked in position. This provides a mechanism to apply graphics like drawing title blocks or company logos. However, you must ensure that the object sent to the 2D overlay fits inside its limited spatial extent. The 2D overlay is a window with an x-extent from -1.0 to 1.0. The y-extent is dependent on the aspect ratio of the viewer. With a default viewer having a 4:3 aspect ratio, it is three-quarters of the x-extent (e.g. -0.75 to 0.75).
trigger_script The trigger_script module provides a powerful way to link parameters and actions of multiple modules. This gives you the ability for a sequence of events to be “triggered” as the result of one or more parameters changing. The modules requires a Python script be created, which runs when you “Add” triggers. Triggers are module parameters that might change and thereby cause the script to be run. The script can do just about ANYTHING.
merge_fields merge_fields combines the input fields from up to 4 separate inputs into a unified single field with any number of nodal data components, which can be output to other modules (for processing), OR directly to the viewer. This is useful when you want to slice through or otherwise subset multiple fields using the same criteria (modules).
float_math This module provides a simple means to perform mathematical operations on numbers coming from up to 4 input ports. By using multiple float_math modules, any number of values may be combined. The panel for float_math is shown above. The default equation is f1 + f2 + f3 + f4 which adds all four input ports.
create_tin The create_tin module is used to convert scattered sample data into a three-dimensional surface of triangular cells representing an unstructured mesh. “Scattered sample data " means that there are discrete nodes in space. An example would be geology or analyte (e.g. chemistry) data where the coordinates are the x, y, and elevation of a measured parameter. The data is “scattered” because there is not necessarily an implicit grid of data.
material_to_cellsets material_to_cellsets is intended to receive a 3D field into its input port which has been processed through a module like plume. If the original field (pre-plume) had multiple cell sets related to geologic units or materials the output of plume will generally have only two cell sets which comprise all hexahedron and all tetrahedron cells. The ability to control the visibility of the layer-cell sets is normally lost.
loop The loop module iterates an operation. For example, you could use a loop object to control the movement of an object in your application; such as incrementing the movement of a slider for a slice plane.
modify_data_3d The modify_data_3d module provides the ability to interactively change data in 3D volumetric models. This is not a recommended practice since volumetric models created in EVS generally have underlying statistical measures of quality that will be meaningless if the data is modified in any way. However, it is not unusual for a model to occasionally have regions where extrapolation artifacts cause shards of plumes to appear. This module provides a way to remove those.
Delete this text and replace it with your own content.
Subsections of Tools
group objects
group objects is a renderable object that contains other subobjects that have the attributes that control how the rendering is done. Unlike DataObject, group objects does not include data. Instead, it is meant to be a node in the rendering hierarchy that groups other DataObjects together and supplies common attributes from them. This object is connected directly to one of the viewers (for example, Simpleviewer3D) or to another DataObject or to group objects. A group objects is included in all the standard viewers provided with the EVS applications chooses.
Module Input Ports
- Input Objects [Field] Accepts any number red object ports from modules to be grouped
Module Output Ports
- Output Object [Renderable]: Outputs to the viewer.
group objects combines the following:
* DefaultDatamap to convert scalar node or cell data to RGB color values. By default, the datamap’s minimum and maximum values are 0 and 255, respectively. This datamap is inherited by any children objects if they do not have their own datamaps.
* DefaultProps to control color, material, line attribute, and geometrical attributes.
* DefaultModes to control point, line, surface, volume, and bounds rendering modes.
* DefaultPickInfo to contain information when this object is picked.
* DefaultObject to control visibility, pickability, caching, transform mode, surface conversion, and image display attributes.
group objects to 2d overlay
The group objects to 2d overlay moduleprovides a module that applies any connected module’s output to the viewer’s 2D overlay. Objects in the overlay are not transformed (rotated, zoomed, panned). These objects are locked in position. This provides a mechanism to apply graphics like drawing title blocks or company logos.
However, you must ensure that the object sent to the 2D overlay fits inside its limited spatial extent. The 2D overlay is a window with an x-extent from -1.0 to 1.0. The y-extent is dependent on the aspect ratio of the viewer. With a default viewer having a 4:3 aspect ratio, it is three-quarters of the x-extent (e.g. -0.75 to 0.75).
trigger_script
The trigger_script module provides a powerful way to link parameters and actions of multiple modules. This gives you the ability for a sequence of events to be “triggered” as the result of one or more parameters changing.
The modules requires a Python script be created, which runs when you “Add” triggers. Triggers are module parameters that might change and thereby cause the script to be run. The script can do just about ANYTHING.
In addition to the Triggers that you specify, there are 4 input (and output) ports that accept numbers (such as a plume level) that can be used in your script, and are more readily accessible without accessing the Python script.
Module Inpu & Output Ports
- N1 [Number] Accepts a number
- N2 [Number] Accepts a number
- N3 [Number] Accepts a number
- N4 [Number] Accepts a number
merge_fields
merge_fields combines the input fields from up to 4 separate inputs into a unified single field with any number of nodal data components, which can be output to other modules (for processing), OR directly to the viewer. This is useful when you want to slice through or otherwise subset multiple fields using the same criteria (modules).
You must be aware that fields contain more than just grids and data. They contain meta-data set during the creation of those grids and data, including, but not limited to:
- Data Processing (log or linear)
- Coordinate units
- Data units (mg/kg or %)
- Data Min and Max values (ensures that datamaps from kriging match datamaps in post samples)
NOTE: There are potential dangers and serious consequences of merging fields because we allow for merging of data without requiring strict name or meta data matching.
Meta data from the leftmost input field is always used for the merged result.
You can only merge fields having the same number of nodal and/or cell data components.
We do not require strict name matching, therefore it is possible to merge data with very negative consequences. Examples are:
- Benzene data from one input field with Toluene from another field.
- Log Processed TPH data with linear processed TPH data.
- One field with coordinate units of meters with another in feet.
Overlapping Volumes: When you merge fields you must be aware that this is not an alternative way to create the union of multiple plumes.
- The merge fields modules does not remove overlapping volumes.
- Volume calculations with volumetrics can count overlapping regions multiple times giving nonsensical values.
The Merge Cell Sets When Possible option works only if you have matching types and names. A good, and appropriate example is merging fault blocks so that all “Clay” cell sets are controlled as a single entity.
Module Input Ports
- First Input Field [Field] Accepts a data field.
- Second Input Field [Field] Accepts a data field.
- Third Input Field [Field] Accepts a data field.
- Fourth Input Field [Field] Accepts a data field.
Module Output Ports
- Output Field [Field] Outputs the field with all inputs merged
- Output Object [Renderable]: Outputs to the viewer.
float_math
This module provides a simple means to perform mathematical operations on numbers coming from up to 4 input ports. By using multiple float_math modules, any number of values may be combined.
The panel for float_math is shown above. The default equation is f1 + f2 + f3 + f4 which adds all four input ports.
Pop-upAvailable Mathematical Operators hereorJump to Available Mathematical Operators here
Any of these operators may be used.
The output (rightmost output port) is the numeric value resulting from the equation.
The value will update when any of the input values are changed unless the checkbox next to the input value is turned off.
Module Input Ports
- Input Value1 [Number] Accepts number 1
- Input Value 2 [Number] Accepts number 2
- Input Value 3 [Number] Accepts number 3
- Input Value 4 [Number] Accepts number 4
- Input String 1 [String] An input string
Module Output Ports
- Output Value1 [Number] Outputs number 1
- Output Value 2 [Number] Outputs number 2
- Output Value 3 [Number] Outputs number 3
- Output Value 4 [Number] Outputs number 4
- Output String 1 [String] An input string
- Result Value [Number] The final output
create_tin
The create_tin module is used to convert scattered sample data into a three-dimensional surface of triangular cells representing an unstructured mesh.
“Scattered sample data " means that there are discrete nodes in space. An example would be geology or analyte (e.g. chemistry) data where the coordinates are the x, y, and elevation of a measured parameter. The data is “scattered” because there is not necessarily an implicit grid of data.
create_tin uses a proprietary version of the Delaunay tessellation algorithm.
Module Input Ports
- Input Points [Field] Accepts a data field of points or uses the nodes (points) from lines
Module Output Ports
- Output Field [Field] Outputs the surface data field
- Output Object [Renderable]: Outputs to the viewer.
material_to_cellsets
material_to_cellsets is intended to receive a 3D field into its input port which has been processed through a module like plume. If the original field (pre-plume) had multiple cell sets related to geologic units or materials the output of plume will generally have only two cell sets which comprise all hexahedron and all tetrahedron cells. The ability to control the visibility of the layer-cell sets is normally lost.
This module takes plume’s output and recreates the cell sets based on nodal data. However, since each geologic layer will likely have two cell sets each (one for all hexahedron and all tetrahedron cells), the output tends to have twice as many cell sets as the original pre-plume field).
Module Input Ports
- Input Field [Field] Accepts a data field.
Module Output Ports
- Output Field [Field] Outputs the processed field.
loop
The loop module iterates an operation. For example, you could use a loop object to control the movement of an object in your application; such as incrementing the movement of a slider for a slice plane.
modify_data_3d
The modify_data_3d module provides the ability to interactively change data in 3D volumetric models. This is not a recommended practice since volumetric models created in EVS generally have underlying statistical measures of quality that will be meaningless if the data is modified in any way.
However, it is not unusual for a model to occasionally have regions where extrapolation artifacts cause shards of plumes to appear. This module provides a way to remove those.
The basic approach is to move the modification sphere to the problem region and set the size and shape of the ellipsoid before changing your data.
Module Input Ports
- Z Scale [Number] Accepts Z Scale (vertical exaggeration).
- Input Field [Field] Accepts a data field from 3d estimation or other similar modules.
Module Output Ports
- Output Field [Field] Outputs the field with modified data
- Sample Data [Renderable]: Outputs to the viewer
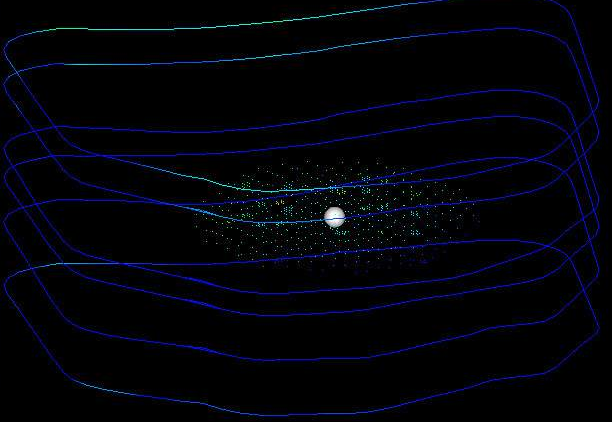
The figure below shows the cloud of points display from this module. Note the adaptively gridded regions with clusters of nodes!
Note: This module does not modify the upstream data.
Delete this text and replace it with your own content.