post_samples The post_samples module is used to visualize: Sampling locations and the values of the properties in .apdv files The lithology specified in a .pgf, .lsdv, .lpdv or .geo files The location and values of well screens in a .aidv file Warning When using the Datamap parameters (Minimum and Maximum) unlinked such the the resulting datamap is a subset of the true data range, probing in C Tech Web Scenes will only be able to report values within the truncated data range. Values outside that limited range will display the nearest value within the truncated range.
explode_and_scale The explode_and_scale module is used to separate (or explode) and apply a scaling factor to the vertical dimension (z-coordinate) of objects in a model. explode_and_scale can also translate the fields in the z direction, and control the visibility of individual cell sets (e.g. geologic layers). Module Input Ports Z Scale [Number] Accepts Z Scale (vertical exaggeration) from other modules Explode [Number] Accepts the Explode distance from other modules Input Field [Field] Accepts a data field from 3d estimation or other similar modules. Module Output Ports
plume shell The plume_shell module creates the external faces of a volumetric subset of a 3D input. The resulting closed volume “shell” generally is used only as a visualization of a plume and would not be used as input for further subsetting or volumetric computations since it is hollow (empty). This module creates a superior visualization of a plume as compared with other modules such as plume passing to external_faces and is quicker and more memory efficient.
intersection_shell The intersection_shell is a powerful module that incorporates some of the characteristics of plume_shell, yet allows for a large number of sequential (serial) subsetting operations, just like intersection. To get the functionality of (the now deprecated) constant_shell module, you would turn off Include Varying Surface. Because this module has “intersection” in its name, it allows you to add any number of subsetting operations.
change_minmax The change_minmax module allows you to override the minimum and/or maximum data values for coloring purposes. This functionality is commonly needed when working with time-series data. For example, the user can set the minmax values to bracket the widest range achieved for many datasets, thus allowing consistent mapping from dataset to dataset during a time-series animation or individual sub-sites.
band data band data provides a means to color surfaces or volumetric objects (converted to surfaces) in solid colored bands. band data can contour by both nodal and cell data. This module does not do subsetting like plume_shell , plume. It is used in conjunction with these modules to change the way their output is colored.
volume_renderer Volume_renderer directly renders a 3D uniform field using either the Back-to-Front (BTF) or Ray-tracing volume rendering techniques. The Ray-tracing mode is available to both OpenGL and the software renderer. The BTF renderer, which is configured as the default, is available only in the OpenGL renderer. NOTE: This module and its rendering technique are not supported in C Tech Web Scenes (CTWS files).
opacity by nodal data opacity by nodal data provides a means to adjust the opacity (1 - transparency) of any object based on its data values using a simple ramp function which assigns a starting opacity to values less than or equal to the Level Start and an ending opacity to values greater than or equal to the Level End. The appearance of the resulting output is often similar in appearance to volume rendering. opacity by nodal data converts data into partially transparent surfaces where data values at each point in a grid are represented by a particular color and opacity.
slope_and_aspect The slope_and_aspect module determines the slope and aspect of a surface. The slope is the angle between the surface and the horizon. The aspect is the cardinal direction in degrees (rotating clockwise with 0° being North) that the slope is facing. Module Input Ports Z Scale [Number] Accepts Z Scale (vertical exaggeration). Input Field [Field] Accepts a field with scalar or vector data. Module Output Ports
select single data The select single data module extracts a single data component from a field. select single data can extract scalar data components or vector components. Scalar components will be output as scalar components and vector components will be output as vector components. Module Input Ports Input Field [Field] Accepts a data field. Module Output Ports Output Field [Field] Outputs the subsetted field as faces. Output Object [Renderable]: Outputs to the viewer.
The import _wavefront_obj module will only read Wavefront Technologies format .OBJ files which include object textures which are represented (includ
Subsections of Display
post_samples
The post_samples module is used to visualize:
- Sampling locations and the values of the properties in .apdv files
- The lithology specified in a .pgf, .lsdv, .lpdv or .geo files
- The location and values of well screens in a .aidv file
Warning
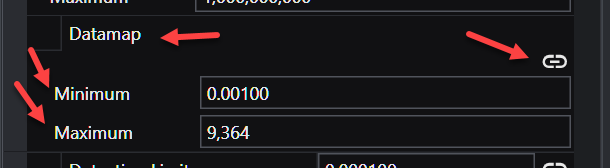
When using the Datamap parameters (Minimum and Maximum) unlinked such the the resulting datamap is a subset of the true data range, probing in C Tech Web Scenes will only be able to report values within the truncated data range. Values outside that limited range will display the nearest value within the truncated range.
Along with a representation of the borings from which the samples/data were collected. The post_samples module has the capability to process property values to make the posted data values consistent with data used in kriging modules. Data can be represented as spheres or any user specified glyph. The sampling locations may be colored and sized according to the magnitude of the property value, and labels can be applied to the sampling locations with several different options.
Each sampling location can probed for data by holding the Ctrl button and left-clicking on the sample location.
When you read any of the supported file types, the module automatically selects the proper default settings to display that data type. However, some file formats can benefit from different options depending on your desires and the quantity of data present.
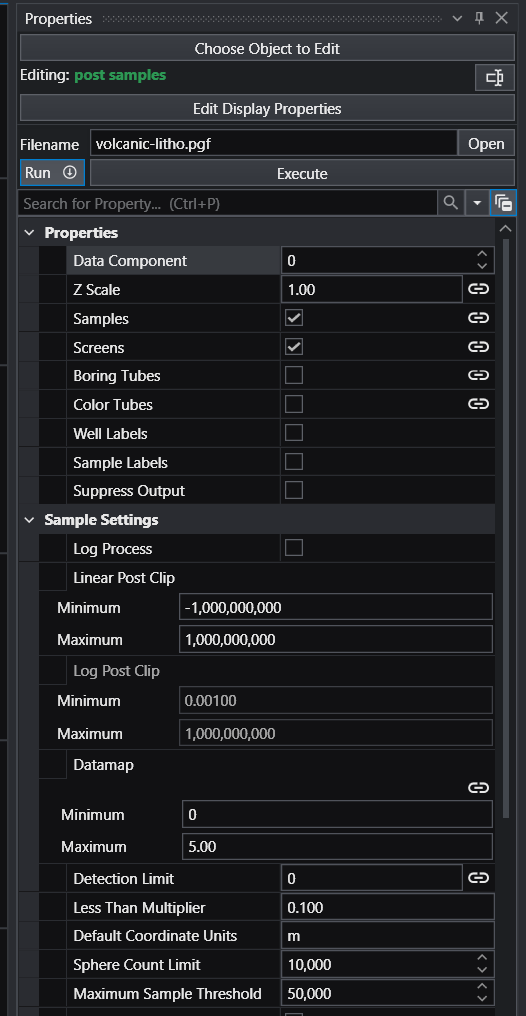
Below is the Properties window for post samples after reading a .PGF file. Note that “Samples” and “Screens” are selected.
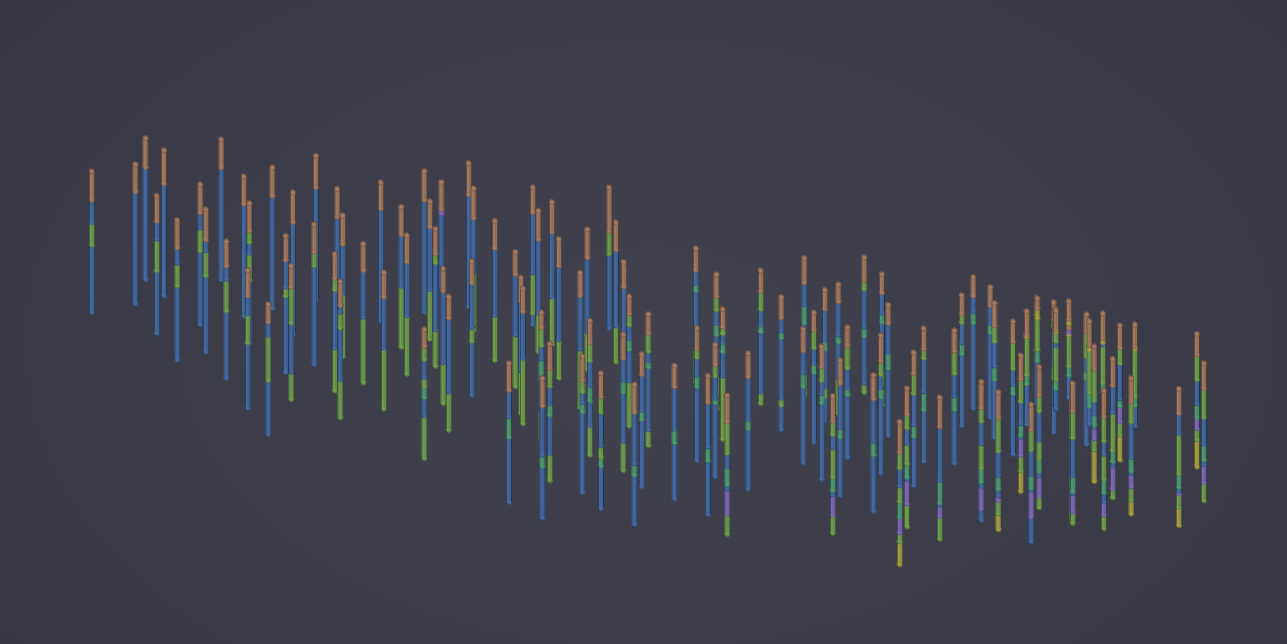
The result in the viewer is below.
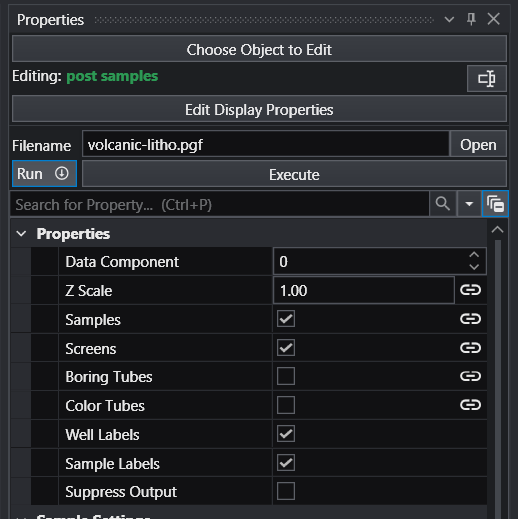
If we turn on Well Labels and Sample Labels (with some subsetting to declutter), the viewer shows:
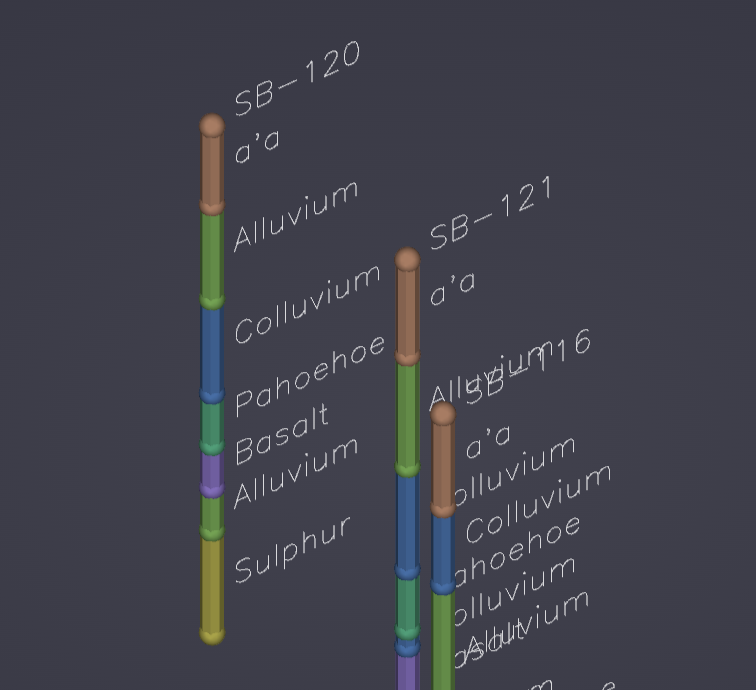
The post_samples module can also represent downhole geophysical logs or Cone Penetration Test (CPT) logs with tubes which are colored and/or sized according to the magnitude of the data. It can display nonvertical borings and data values collected along their length, and can also explode borings and sample locations to show their correct position within exploded geologic layering.
When used to read geology files, post_samples will place surface indicators at the top (ground) surface and the bottom of each geologic layer that are colored according to the layer they depict. When a geology file (.geo or .gmf) is exploded without using geologic surface input from gridding and horizons there will be surface indicators at the top and bottom of each layer. You may color the borings by lithology.
Module Input Ports
- Z Scale [Number] Accepts Z Scale (vertical exaggeration) from other modules
- Explode [Number] Accepts the Explode distance from other modules
- Date [Number] Accepts a date to interpolate time domain data
- Input Geologic Field [Field] Accepts a data field from gridding and horizons to krige data into geologic layers.
- Subsetting Feature [Field] Accepts a (1D) line or (2D) surface to be used to subset the borings.
- Sample Glyph [Field] Allows the user to import a field containing a geometric object which will be the glyph displayed at each sample location.
- Filename [String / minor] Allows the sharing of file names between similar modules.
Module Output Ports
- Z Scale [Number] Outputs Z Scale (vertical exaggeration) to other modules
- Explode [Number] Outputs the Explode distance to other modules
- Geologic legend Information [Geology legend] Supplies the geologic material information for the legend module.
- Boring Tubes [Field / minor] Outputs the tube paths as lines with data
- Boring Data [Field / minor] Outputs the tube paths as lines with data
- Filename [String / minor] Allows the sharing of file names between similar modules.
- Analytes Name [String / minor] Outputs a string containing the name of the currently selected analyte or date
- Sample Data [Renderable]: Outputs to the viewer
Properties and Parameters
The Properties window is arranged in the following groups of parameters:
- Properties:
- selected data component
- Z Scale (remember this should be set on the Home tab or Application properties)
- Display Toggles: including screens, borings, well and/or sample labeling, etc.
- Sample Settings: controls clipping, processing (Log) and clamping of data.
- Collapse to 2D: controls how 3D data is subset to 2D
- Geology Settings: controls the display of geologic data
- Time Settings: controls how the module deals with time domain data
- Boring Tube Settings: controls how borings are displayed
- Color Tube Settings: controls the display of colored tubes as an alternative representation (vs. spheres or glyphs)
- Label Settings: parameters association with labeling of borings and samples
- Remember that toggles to turn on labels for Wells or Samples are at the top in Properties.
- There are type-ins which receive Python expressions providing a great deal of power to adjust how you label wells and samples
- Default expressions (which vary by file type) are automatically created for you (when these are Linked) to make the labeling more logical.
EXAMPLE .PT FILE & OUTPUT
explode_and_scale
The explode_and_scale module is used to separate (or explode) and apply a scaling factor to the vertical dimension (z-coordinate) of objects in a model. explode_and_scale can also translate the fields in the z direction, and control the visibility of individual cell sets (e.g. geologic layers).
Module Input Ports
- Z Scale [Number] Accepts Z Scale (vertical exaggeration) from other modules
- Explode [Number] Accepts the Explode distance from other modules
- Input Field [Field] Accepts a data field from 3d estimation or other similar modules.
Module Output Ports
- Z Scale [Number] Outputs Z Scale (vertical exaggeration) to other modules
- Explode [Number] Outputs the Explode distance to other modules
- Output Field [Field / minor] Outputs the field with the scaling and exploding applied.
Properties and Parameters
The Properties window is arranged in the following groups of parameters:
- Properties: controls the scaling, exploding and Z translation
- Explode And Scale Settings: controls layer exploding and cell sets
plume shell
The plume_shell module creates the external faces of a volumetric subset of a 3D input. The resulting closed volume “shell” generally is used only as a visualization of a plume and would not be used as input for further subsetting or volumetric computations since it is hollow (empty). This module creates a superior visualization of a plume as compared with other modules such as plume passing to external_faces and is quicker and more memory efficient.
Info
- The plume shell module may be controlled with the driven sequence module.
Module Input Ports
- Input Field [Field] Accepts a data field.
- Isolevel [Number] Accepts the subsetting level.
Module Output Ports
- Output Field [Field] Outputs the subsetted field as a closed surface.
- Status [String / minor] Outputs a string containing a description of the operation being performed (e.g. TCE plume above 4.00 mg/kg)
- Isolevel [Number] Outputs the subsetting level.
- Plume [Renderable]: Outputs to the viewer.
intersection_shell
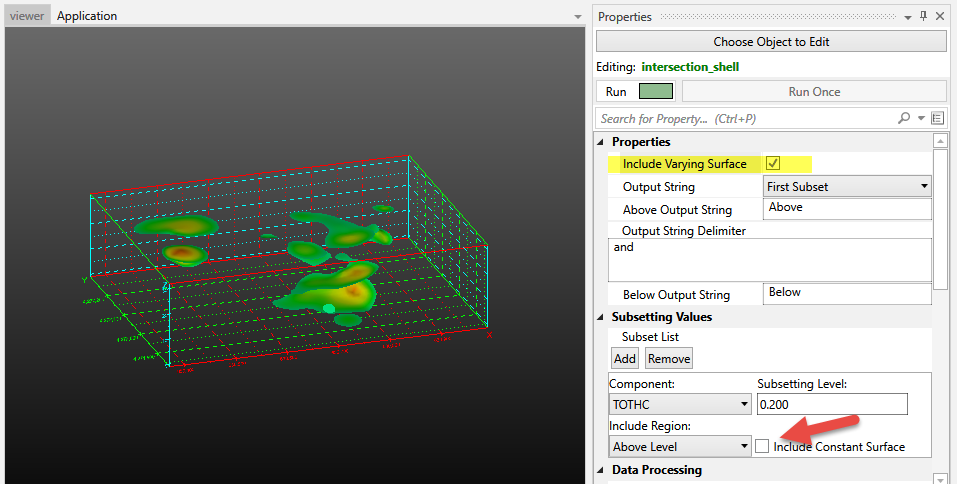
The intersection_shell is a powerful module that incorporates some of the characteristics of plume_shell, yet allows for a large number of sequential (serial) subsetting operations, just like intersection.
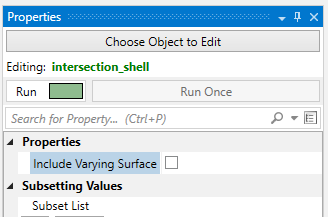
To get the functionality of (the now deprecated) constant_shell module, you would turn off Include Varying Surface.
Because this module has “intersection” in its name, it allows you to add any number of subsetting operations.
Each operation can be “Above” or “Below” the specified Threshold value, which in Boolean terms corresponds to:
- A and B where both the A & B operations are set to Above or
- A and (NOT B) where the A operation is set to above and the B operation is set to Below.
However the operator is always “and” for intersection modules. If you need an “or” operator to achieve your subsetting, you need the union module.
This module creates an efficient and superior visualization of a plume that can be sent directly to the viewer for rendering. The intersection_shell module outputs a specialized version of a sequentially subset plume that is suitable for VRML export for 3D printing to create full color physical models.
For output to 3D printing, please jump to the Issues for 3D Printing topic.
Without intersection_shell it is very difficult if not impossible to create a VRML file suitable for printing, especially with complex models.
Module Input Ports
- Input Field [Field] Accepts a data field.
Module Output Ports
- Output Field [Field] Outputs the subsetted field as a closed surface.
- Output Object [Renderable]: Outputs to the viewer.
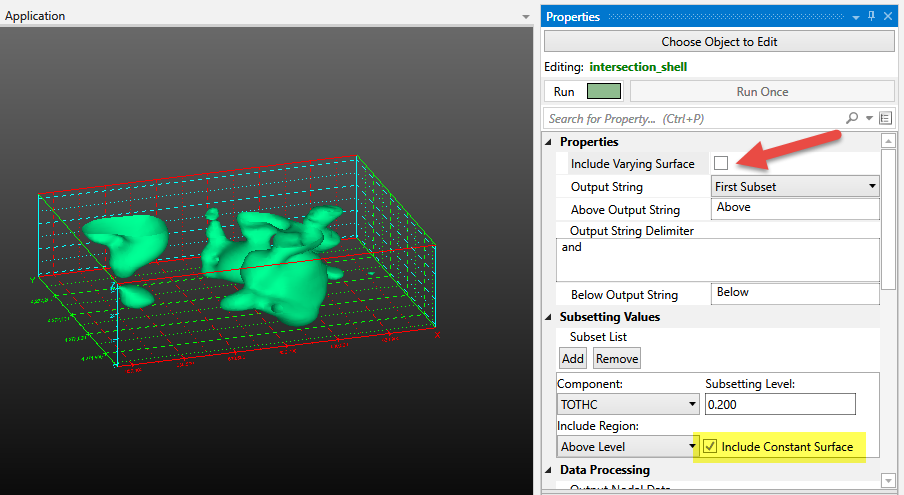
intersection_shell is the module that can create an ISOSURFACE. In other words, a surface (not volume) representing part(s) of your plume.
It has two (+) toggles which control the visibility of a plume “shell”.
In general a plume external shell has two components:That portion which is exactly EQUAL to the Subsetting LevelThat portion which is greater than the Subsetting Level
When both toggles are on (default) the plume is
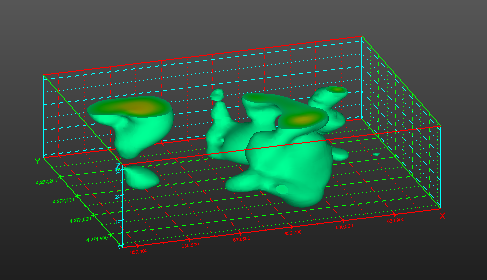
If you display only the Constant Surface (component 1) you get this
If you display only the Varying Surface (component 2) you get this
change_minmax
The change_minmax module allows you to override the minimum and/or maximum data values for coloring purposes. This functionality is commonly needed when working with time-series data. For example, the user can set the minmax values to bracket the widest range achieved for many datasets, thus allowing consistent mapping from dataset to dataset during a time-series animation or individual sub-sites.
This way 100 ppm would always be red throughout the animation, and if some times did not reach a maximum of 100 ppm, there would be no red color mapping for those time-steps.
NOTE: The Clamp toggle actually changes the data. Use with caution as this will change volumetrics results.
Warning
When using unlinked values (Min and Max) such the the resulting datamap is a subset of the true data range, probing in C Tech Web Scenes will only be able to report values within the truncated data range. Values outside that limited range will display the nearest value within the truncated range.
Module Input Ports
- Input Field [Field] Accepts a data field.
Module Output Ports
- Output Field [Field] Outputs the field with altered data min/max values
- Output Object [Renderable]: Outputs to the viewer.
band data
band data provides a means to color surfaces or volumetric objects (converted to surfaces) in solid colored bands.
band data can contour by both nodal and cell data.
This module does not do subsetting like plume_shell , plume. It is used in conjunction with these modules to change the way their output is colored.
Module Input Ports
- Input Field [Field] Accepts a data field.
- Input Contour Levels [Contours]: Accepts an array of values representing values to place contours
Module Output Ports
- Output Field [Field] Outputs the field with altered data min/max values
- Output Contour Levels [Contours]: Outputs an array of values representing values to be labeled in the legend.
- Output Object [Renderable]: Outputs to the viewer.
volume_renderer
Volume_renderer directly renders a 3D uniform field using either the Back-to-Front (BTF) or Ray-tracing volume rendering techniques. The Ray-tracing mode is available to both OpenGL and the software renderer. The BTF renderer, which is configured as the default, is available only in the OpenGL renderer.
NOTE: This module and its rendering technique are not supported in C Tech Web Scenes (CTWS files).
The basic concept of volume rendering is quite different than anything other rendering technique in EVS. Volume_renderer converts data into a fuzzy transparent cloud where data values at each point in a 3D grid are represented by a particular color and opacity.
Module Input Ports
- Input Field [Field] Accepts a data field.
Module Output Ports
- Output Object [Renderable]: Outputs to the viewer.
opacity by nodal data
opacity by nodal data provides a means to adjust the opacity (1 - transparency) of any object based on its data values using a simple ramp function which assigns a starting opacity to values less than or equal to the Level Start and an ending opacity to values greater than or equal to the Level End. The appearance of the resulting output is often similar in appearance to volume rendering. opacity by nodal data converts data into partially transparent surfaces where data values at each point in a grid are represented by a particular color and opacity.
NOTE: Any module connected after opacity by nodal data MUST have Normals Generation set to Vertex (if there is a Normals Generation toggle on the module’s panel, it must be OFF).
- The leftmost port accepts an input field
Module Output Ports
- The output field which passes the original data with a special new “opacity” data component for use with downstream modules (e.g. slice, plume_shell, etc.)
- The (red) port for connection to the viewer.
slope_and_aspect
The slope_and_aspect module determines the slope and aspect of a surface. The slope is the angle between the surface and the horizon. The aspect is the cardinal direction in degrees (rotating clockwise with 0° being North) that the slope is facing.
Module Input Ports
- Z Scale [Number] Accepts Z Scale (vertical exaggeration).
- Input Field [Field] Accepts a field with scalar or vector data.
Module Output Ports
- Output Field [Field] Outputs both slope and aspect data as a field
- Output Slope Object [Renderable]: Outputs to the viewer.
- Output Aspect Object [Renderable]: Outputs to the viewer.
select single data
The select single data module extracts a single data component from a field. select single data can extract scalar data components or vector components. Scalar components will be output as scalar components and vector components will be output as vector components.
Module Input Ports
- Input Field [Field] Accepts a data field.
Module Output Ports
- Output Field [Field] Outputs the subsetted field as faces.
- Output Object [Renderable]: Outputs to the viewer.
The import _wavefront_obj module will only read Wavefront Technologies format .OBJ files which include object textures which are represented (included) as a single image file. Each file set is actually a set of 3 files which must always include the following 3 files types with the same base file name, which must be in the same folder:
- The .obj file (this is the file that we browse for)
- A .mtl (Material Template Library) file
- An image file (e.g. .jpg) which is used for the texture. Note: there must be only ONE image/texture file. We do not support multiple texture files.
This module provides the user with the capability to integrate complex photo-realistic site plans, buildings, and other 3D features into the EVS visualization, to provide a frame of reference for understanding the three dimensional relationships between the site features, and characteristics of geologic, hydrologic, and chemical features.
Info
This module intentionally does not have a Z-Scale port since this class of files are so often not in a user’s model projected coordinate system. Instead we are providing a Transform Settings group that allows for a much more complex set of transformations including scaling, translations and rotations.
Module Output Ports
- Output Object [Renderable]: Outputs to the viewer
Properties and Parameters
The Properties window includes the following parameters:
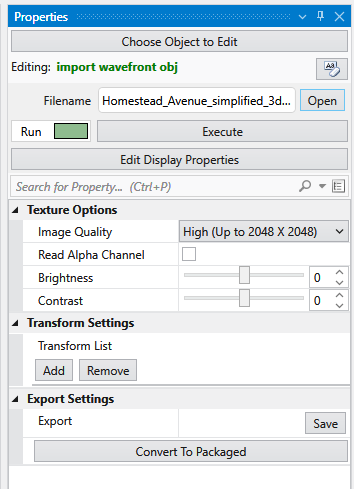
Texture Options: These allow you to enhance the image used for texturing to achieve the best looking final output.
Transform Settings: This allows you to add any number of Translation or Scale transformations in order to place your Wavefront Object in the same coordinate space as the rest of your “Real-World” model. It is very typical that Wavefront Objects are in a rather arbitrary local coordinate system that will have no defined transformation to any standard coordinate projection.
Generally you should know if the coordinates are feet of meters and if those are not correct, do that scaling as your first set of transforms.
It will be up to you to determine the set of translations that will properly place this object in your model. Hopefully rotations will not be required, but they are possible with the Transform List.